Usage#
To use cudf.pandas, enable it before importing or using pandas using one of
these methods:
With Jupyter/IPython magics:
%load_ext cudf.pandasWhen executing a Python script from the command line:
python -m cudf.pandas script.pyFrom a script or from the Python interpreter:
import cudf.pandas; cudf.pandas.install()
See the instructions below for more information about each method.
Jupyter Notebook or IPython Usage#
Load the cudf.pandas extension at the beginning of your notebook or IPython
session. After that, just import pandas and operations will use the GPU:
%load_ext cudf.pandas

import pandas as pd

URL = "https://github.com/plotly/datasets/raw/master/tips.csv"
df = pd.read_csv(URL)                 # uses the GPU
df["size"].value_counts()             # uses the GPU
df.groupby("size").total_bill.mean()  # uses the GPU
df.apply(list, axis=1)                # uses the CPU (fallback)
Note
If you have already imported or used pandas in your current kernel session,
you will need to restart your kernel and run %load_ext cudf.pandas as the
first command before any pandas imports or usage.
Command Line Usage#
From the command line, run your Python scripts with -m cudf.pandas:
python -m cudf.pandas script.py
This will make import pandas use cudf.pandas acceleration with zero code change.
Import Usage#
Another way to enable cudf.pandas is via explicit import. If you are running
a script where you cannot control the command line flags, this is another
option that enables cudf.pandas with minimal code changes. Be sure that
cudf.pandas.install() is called before importing pandas. This also works
in Jupyter notebook or IPython environments.
import cudf.pandas
cudf.pandas.install()

import pandas as pd
Working with multiprocessing or concurrent.futures#
To use a pool of workers (for example
multiprocessing.Pool
or
concurrent.futures.ProcessPoolExecutor)
in your script with cudf.pandas, the cudf.pandas module must be
loaded on the worker processes, as well as by the controlling script.
The most foolproof way to do this is to programmatically install
cudf.pandas at the top of your script, before anything else.
For example
# This is equivalent to python -m cudf.pandas, but will run on the
# workers too. These two lines must run before pandas is imported,
# either directly or transitively.
import cudf.pandas
cudf.pandas.install()

from multiprocessing import Pool

with Pool(4) as pool:
    # use pool here
    ...
Profiling cudf.pandas#
cudf.pandas will attempt to use the GPU whenever possible and fall
back to CPU for certain operations. Running your code with the
cudf.pandas.profile magic generates a report showing which
operations used the GPU and which used the CPU. This can help you
identify parts of your code that could be rewritten to be more
GPU-friendly.
Using the Function Profiler#
First, enable cudf.pandas:
%load_ext cudf.pandas
import pandas as pd
Next, use the IPython/Jupyter magic cudf.pandas.profile:
%%cudf.pandas.profile
df = pd.DataFrame({'a': [0, 1, 2], 'b': [3, 4, 3]})

df.min(axis=1)
out = df.groupby('a').filter(
    lambda group: len(group) > 1
)
This gives a profiler output after the cell runs, shown below.
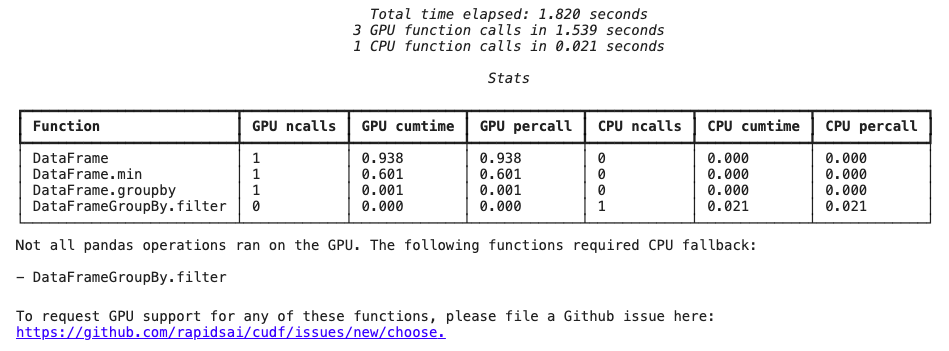
When an operation falls back to using the CPU, it’s typically because that operation isn’t implemented by cuDF. The profiler generates a handy link to report the missing functionality to the cuDF team.
Using the Line Profiler#
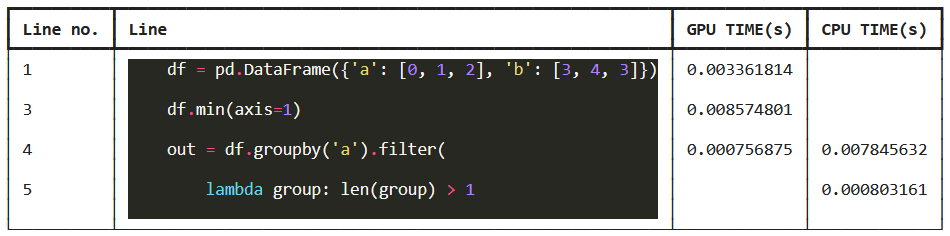
There is a line profiler activated by the IPython/Jupyter magic cudf.pandas.line_profile:
%%cudf.pandas.line_profile
df = pd.DataFrame({'a': [0, 1, 2], 'b': [3, 4, 3]})

df.min(axis=1)
out = df.groupby('a').filter(
    lambda group: len(group) > 1
)
The output of the line profiler shows the source code and how much time each line spent executing on the GPU and CPU.
Profiling from the Command Line#
To profile a script being run from the command line, pass the
--profile argument:
python -m cudf.pandas --profile script.py
cudf.pandas CLI Features#
Several of the ways to provide input to the python interpreter also work with python -m cudf.pandas, such as the REPL, the -c flag, and reading from stdin.
Executing python -m cudf.pandas with no script name will enter a REPL (read-eval-print loop) similar to the behavior of the normal python interpreter.
The -c flag accepts a code string to run, like this:
$ python -m cudf.pandas -c "import pandas; print(pandas)"
<module 'pandas' (ModuleAccelerator(fast=cudf, slow=pandas))>
Users can also provide code to execute from stdin, like this:
$ echo "import pandas; print(pandas)" | python -m cudf.pandas
<module 'pandas' (ModuleAccelerator(fast=cudf, slow=pandas))>