NYC Taxi data using dask_cudf#
Import cuxfilter#
[1]:
from cuxfilter import charts
import cuxfilter
from bokeh import palettes
from cuxfilter.layouts import feature_and_double_base

import cudf, dask_cudf

from dask.distributed import Client, wait
from dask_cuda import LocalCUDACluster

cluster = LocalCUDACluster()
client = Client(cluster)
client
2023-08-04 09:36:04,146 - distributed.comm.ucx - WARNING - Worker with process ID 1749082 should have a CUDA context assigned to device 0 (b'GPU-c7acdf78-2f19-d90c-d052-c058fd2aea86'), but instead the CUDA context is on device 1 (b'GPU-0fe3b0d0-5693-64c1-43e2-124758c12417'). This is often the result of a CUDA-enabled library calling a CUDA runtime function before Dask-CUDA can spawn worker processes. Please make sure any such function calls don't happen at import time or in the global scope of a program.
2023-08-04 09:36:04,217 - distributed.comm.ucx - WARNING - Worker with process ID 1749084 should have a CUDA context assigned to device 1 (b'GPU-0fe3b0d0-5693-64c1-43e2-124758c12417'), but instead the CUDA context is on device 0 (b'GPU-c7acdf78-2f19-d90c-d052-c058fd2aea86'). This is often the result of a CUDA-enabled library calling a CUDA runtime function before Dask-CUDA can spawn worker processes. Please make sure any such function calls don't happen at import time or in the global scope of a program.
[1]:
Client
Client-011bc397-32e5-11ee-afe5-38d547278a24
| Connection method: Cluster object | Cluster type: dask_cuda.LocalCUDACluster |
| Dashboard: http://127.0.0.1:8787/status |
Cluster Info
LocalCUDACluster
614b08a2
| Dashboard: http://127.0.0.1:8787/status | Workers: 2 |
| Total threads: 2 | Total memory: 31.25 GiB |
| Status: running | Using processes: True |
Scheduler Info
Scheduler
Scheduler-c1423e54-d329-44a3-8cb7-115db68846b9
| Comm: tcp://127.0.0.1:37385 | Workers: 2 |
| Dashboard: http://127.0.0.1:8787/status | Total threads: 2 |
| Started: Just now | Total memory: 31.25 GiB |
Workers
Worker: 0
| Comm: tcp://127.0.0.1:37797 | Total threads: 1 |
| Dashboard: http://127.0.0.1:45565/status | Memory: 15.63 GiB |
| Nanny: tcp://127.0.0.1:36411 | |
| Local directory: /tmp/dask-scratch-space/worker-b0gcvvac | |
| GPU: NVIDIA TITAN RTX | GPU memory: 24.00 GiB |
Worker: 1
| Comm: tcp://127.0.0.1:35853 | Total threads: 1 |
| Dashboard: http://127.0.0.1:44065/status | Memory: 15.63 GiB |
| Nanny: tcp://127.0.0.1:45963 | |
| Local directory: /tmp/dask-scratch-space/worker-8h9vcqcw | |
| GPU: Quadro GV100 | GPU memory: 32.00 GiB |
[2]:
#update data_dir if you have downloaded datasets elsewhere
DATA_DIR = './data'
Download required datasets#
[ ]:
from cuxfilter.sampledata import datasets_check
datasets_check('nyc_taxi', base_dir=DATA_DIR)
preprocess the data#
[ ]:
cudf_df = cudf.read_csv(DATA_DIR + '/nyc_taxi.csv')

from pyproj import Proj, Transformer

# Apply transformation
transform_4326_to_3857 = Transformer.from_crs('epsg:4326', 'epsg:3857')
cudf_df['dropoff_x'], cudf_df['dropoff_y'] = transform_4326_to_3857.transform(
                                                cudf_df['dropoff_latitude'].values_host, cudf_df['dropoff_longitude'].values_host
                                            )

cudf_df = cudf_df.drop(['dropoff_latitude', 'dropoff_longitude'], axis=1)
cudf_df = cudf_df.dropna(axis=0)

# Filter over Manhattan
cudf_df = cudf_df[
    (cudf_df.dropoff_x > -8239910.23) & (cudf_df.dropoff_x < -8229529.24) & (cudf_df.dropoff_y > 4968481.34) & (cudf_df.dropoff_y < 4983152.92)
]

cudf_df.tpep_pickup_datetime = cudf.to_datetime(cudf_df.tpep_pickup_datetime, format="%Y-%m-%d")
cudf_df.tpep_dropoff_datetime = cudf.to_datetime(cudf_df.tpep_dropoff_datetime, format="%Y-%m-%d")
cudf_df.head()
Convert cudf df to dask_cudf df#
[ ]:
cudf_df = dask_cudf.from_cudf(cudf_df, npartitions=2).persist()
Read the dataset#
[ ]:
cux_df = cuxfilter.DataFrame.from_dataframe(cudf_df)
Define charts#
Uncomment the below lines and replace MAPBOX_TOKEN with mapbox token string if you want to use mapbox map-tiles. Can be created for free here -https://www.mapbox.com/help/define-access-token/
[ ]:
#from cuxfilter.assets.custom_tiles import get_provider, Vendors
#tile_provider = get_provider(Vendors.MAPBOX_LIGHT, access_token=MAPBOX_TOKEN)
[ ]:
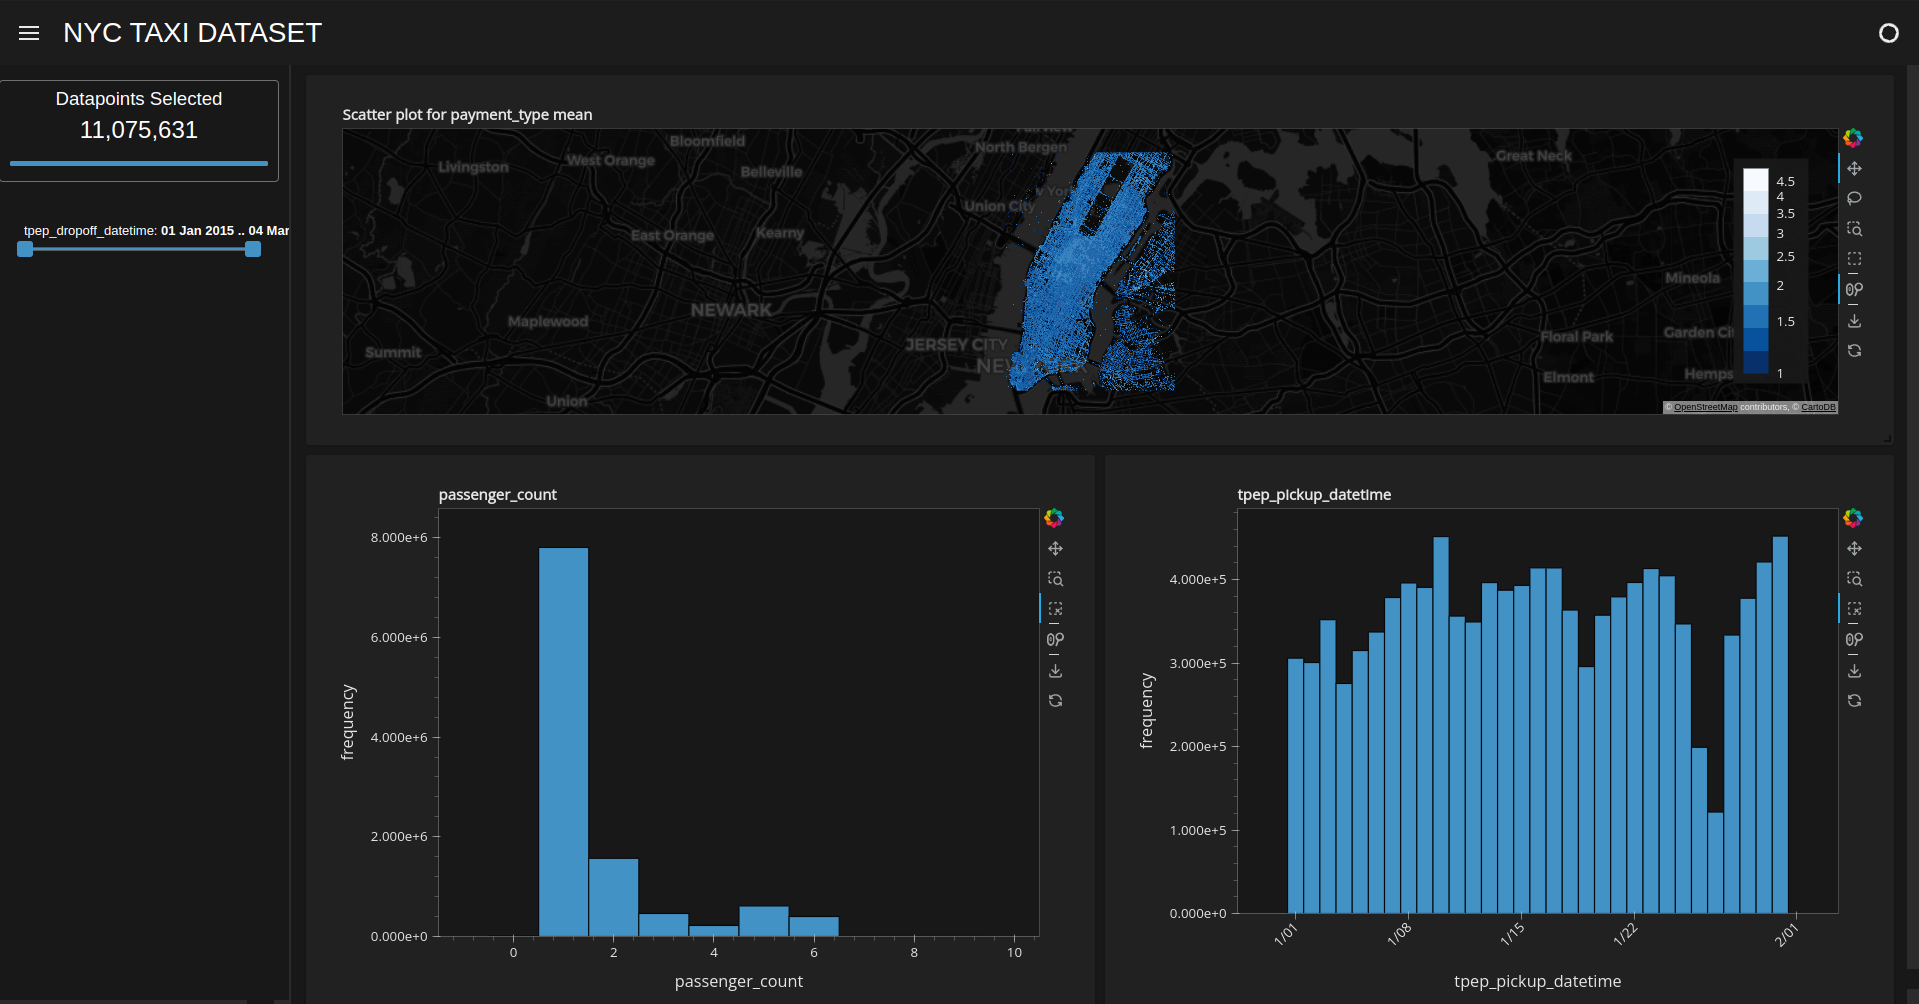
chart1 = charts.scatter(x='dropoff_x',
                         y='dropoff_y',
                         aggregate_fn='mean',aggregate_col='payment_type', pixel_shade_type='log', legend_position='top_right',
                         tile_provider="CartoLight", x_range=(-8239910.23,-8229529.24), y_range=(4968481.34,4983152.92)), unselected_alpha=0.2

chart2 = charts.bar('passenger_count', data_points=9)
chart3 = cuxfilter.charts.bar('tpep_pickup_datetime')
chart4 = cuxfilter.charts.date_range_slider('tpep_dropoff_datetime')
Create a dashboard object#
[ ]:
d = cux_df.dashboard([chart1, chart2, chart3], sidebar=[chart4], layout=feature_and_double_base, theme=cuxfilter.themes.dark, title= 'NYC TAXI DATASET')
Starting the dashboard#
d.show(‘current_notebook_url:current_notebook_port’) remote dashboard
d.app() inline within the notebook cell
Incase you need to stop the server:
d.stop()
[ ]:
#run dashboard inline within the notebook cell
d.show()
Export the queried data into a dataframe#
[ ]:
queried_df = d.export()