Layouts#
cuxfilter has both preset and custom layout options. See examples below on how to use both.
Download Dataset#
[1]:
from cuxfilter.sampledata import datasets_check
[ ]:
DATA_DIR = "./data"
! curl https://data.rapids.ai/viz-data/146M_predictions_v2.arrow.gz --create-dirs -o $DATA_DIR/146M_predictions_v2.arrow.gz
datasets_check("mortgage", base_dir=DATA_DIR)
Import and Setup Charts#
[ ]:
from cuxfilter import charts
import cuxfilter
from bokeh import palettes
import panel as pn
cux_df = cuxfilter.DataFrame.from_arrow("./data/146M_predictions_v2.arrow")
chart0 = charts.choropleth(
x="zip",
color_column="delinquency_12_prediction",
color_aggregate_fn="mean",
geo_color_palette=palettes.Purples9,
geoJSONSource="https://raw.githubusercontent.com/rapidsai/cuxfilter/GTC-2018-mortgage-visualization/javascript/demos/GTC%20demo/public/data/zip3-ms-rhs-lessprops.json",
nan_color="white",
)
chart1 = charts.bar("dti")
chart2 = charts.bar("delinquency_12_prediction", data_points=50)
chart3 = charts.bar("borrower_credit_score", step_size=1)
chart4 = charts.bar("seller_name")
chart5 = charts.scatter(x="loan_id", y="current_actual_upb")
chart6 = charts.scatter("zip", "dti")
chart7 = charts.heatmap(
"dti",
"borrower_credit_score",
aggregate_col="delinquency_12_prediction",
aggregate_fn="mean",
)
chart8 = charts.line("loan_id", "borrower_credit_score")
# create a list of charts
charts_list = [
chart0,
chart3,
chart1,
chart2,
chart4,
chart5,
chart6,
chart7,
chart8,
]
widgets = [
charts.multi_select("dti"),
charts.card(
pn.pane.Markdown("""
## Sample Palette Legend
-  `#A932FF`: Purple 1
-  `#8E44AD`: Purple 2
-  `#6C3483`: Purple 3
-  `#512E5F`: Purple 4
-  `#341C4E`: Purple 5
""")
),
]
User-defined Layouts#
Layout_array#
Custom layouts are applied using an input parameter to the .dashboard() api, called layout_array.
Layout array is a list-of-lists, representing a 2-dimensional layout page. Each list is mapped to an entire row of the layout. A list contains chart numbers (starting from 1 to n), representing their exact position on the page. The input array is automatically scaled to fit the entire screen.
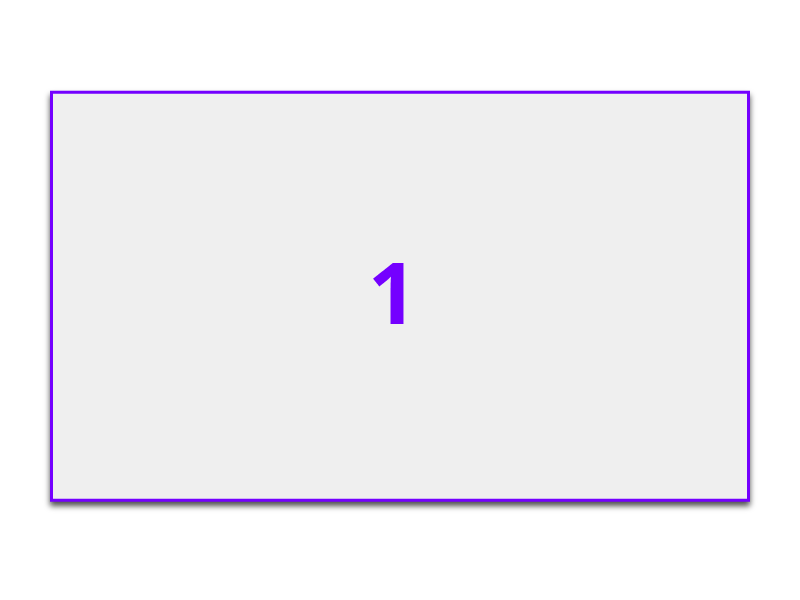
Example 1:#
layout_array = [[1]]
will result in a single chart occupying the entire page.
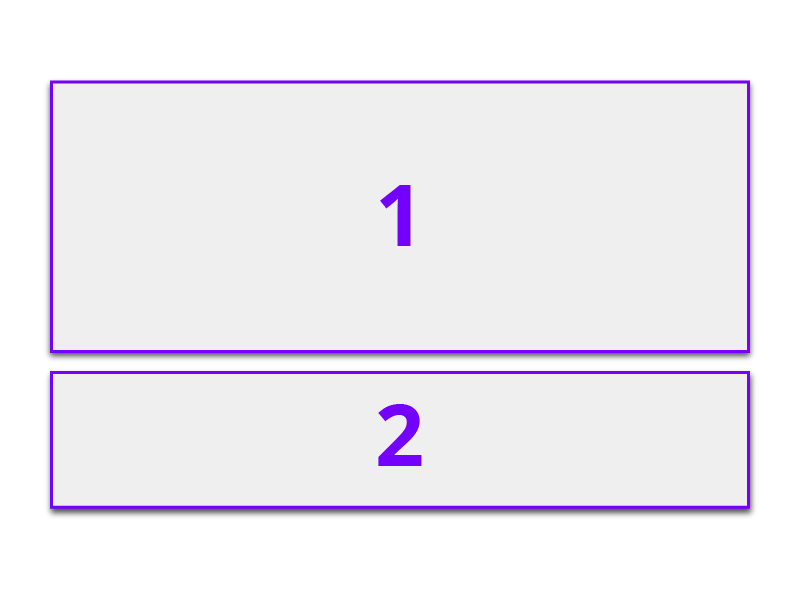
Example 2:#
layout_array = [[1], [1], [2]]
will result chart 1 occupying the first two rows and chart 2 occupying the last row, roughly dividing the 2-chart layout to a 66%-33% ration.
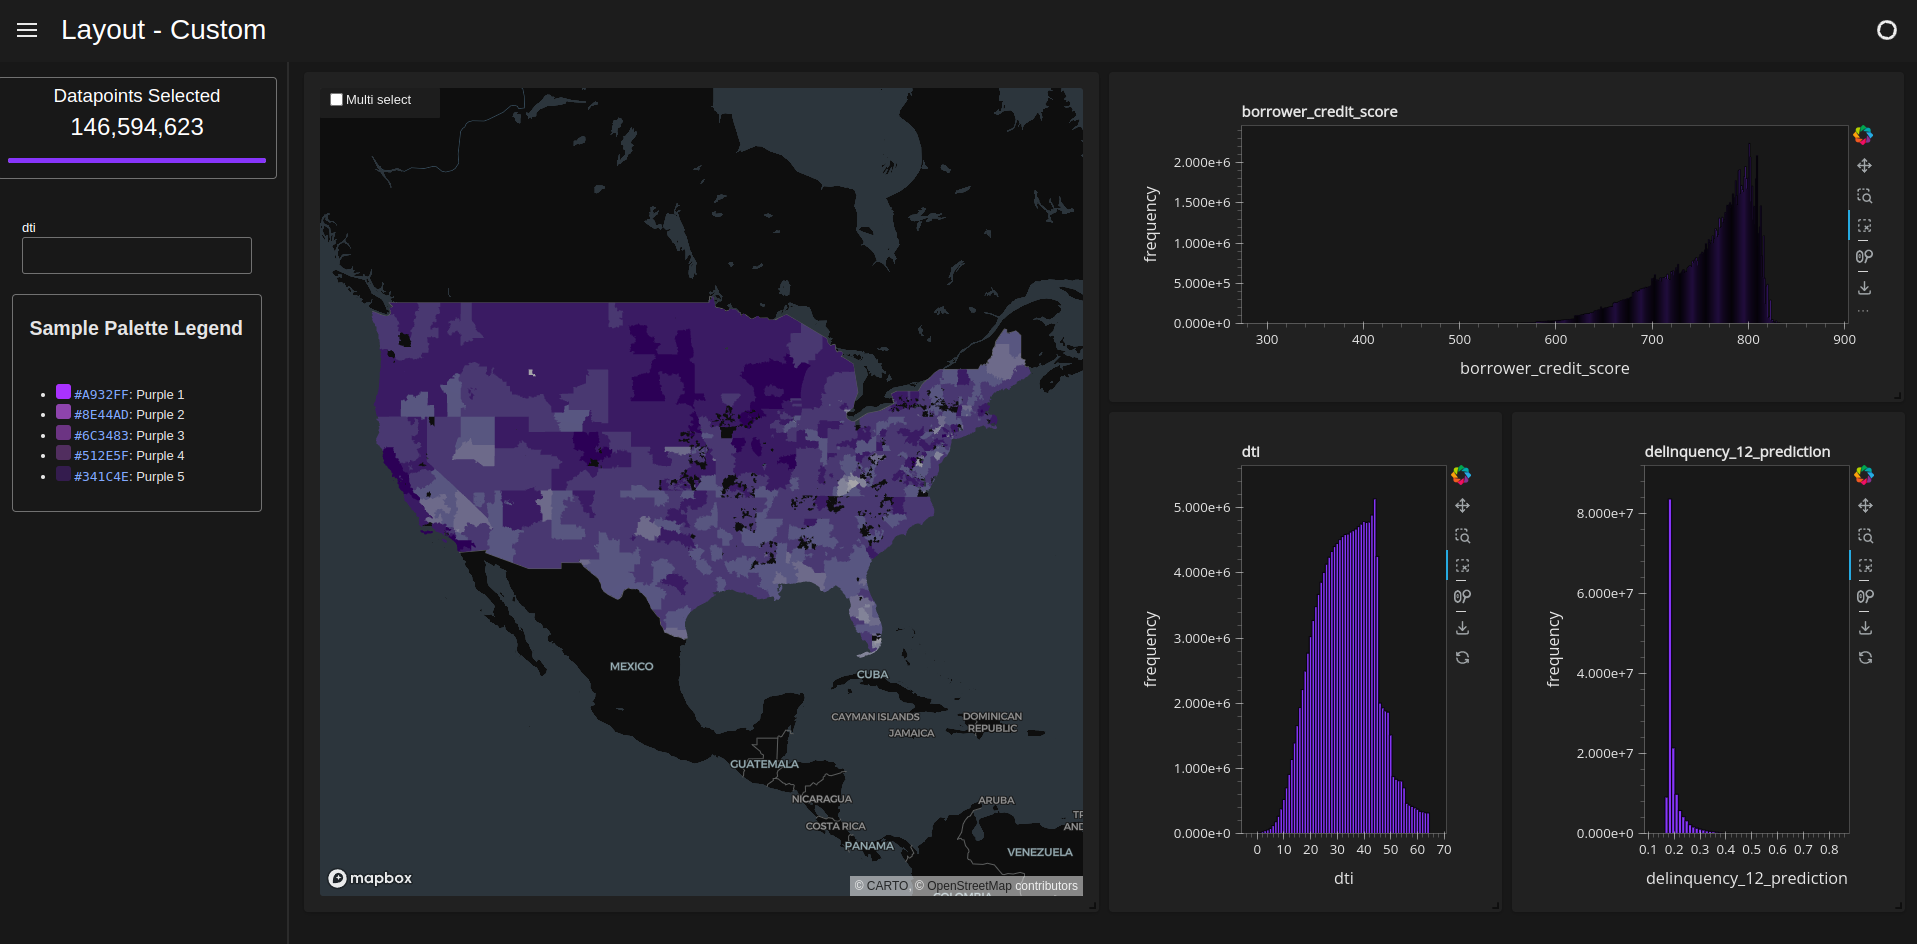
Example 3:#
[ ]:
d = cux_df.dashboard(
    charts_list,
    sidebar=widgets,
    layout_array=[[1, 1, 2, 2], [1, 1, 3, 4]],
    theme=cuxfilter.themes.rapids_dark,
    title="Layout - Custom",
)
Preset Layouts#
Preset layouts are applied using an input parameter to the .dashboard() api, called layout.
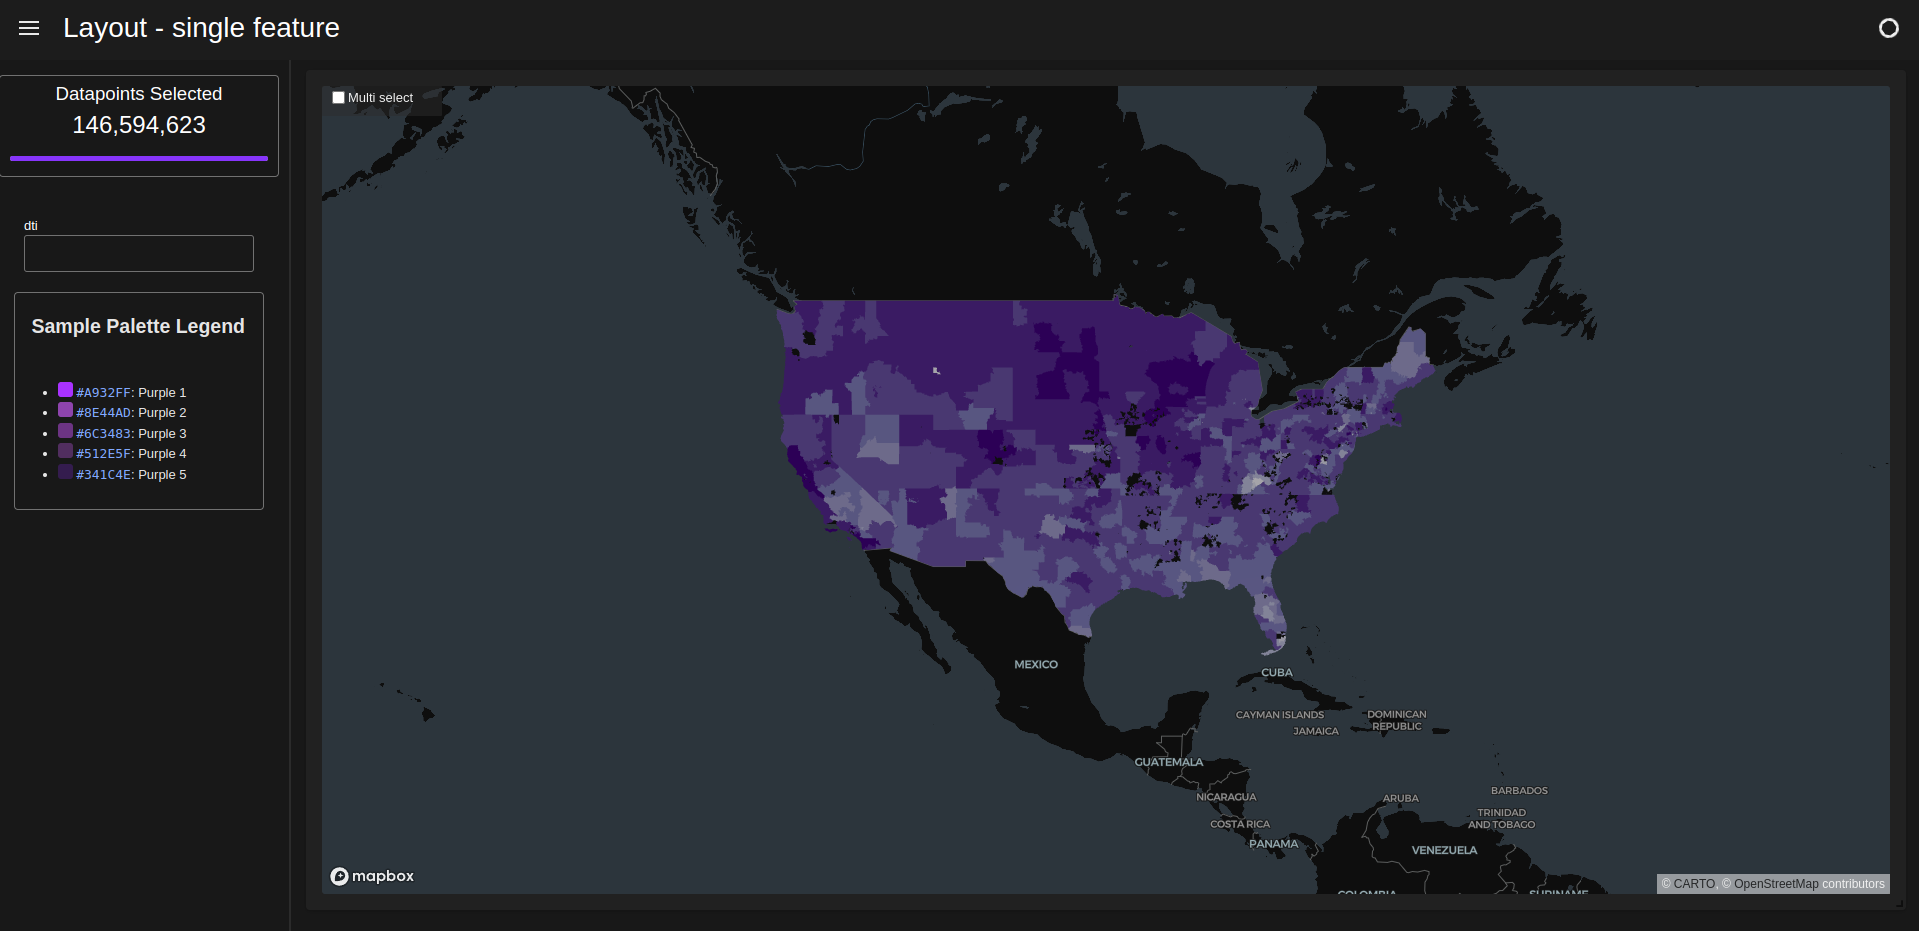
Single feature#
[ ]:
d = cux_df.dashboard(
    charts_list,
    sidebar=widgets,
    layout=cuxfilter.layouts.single_feature,
    theme=cuxfilter.themes.rapids_dark,
    title="Layout - single feature",
)
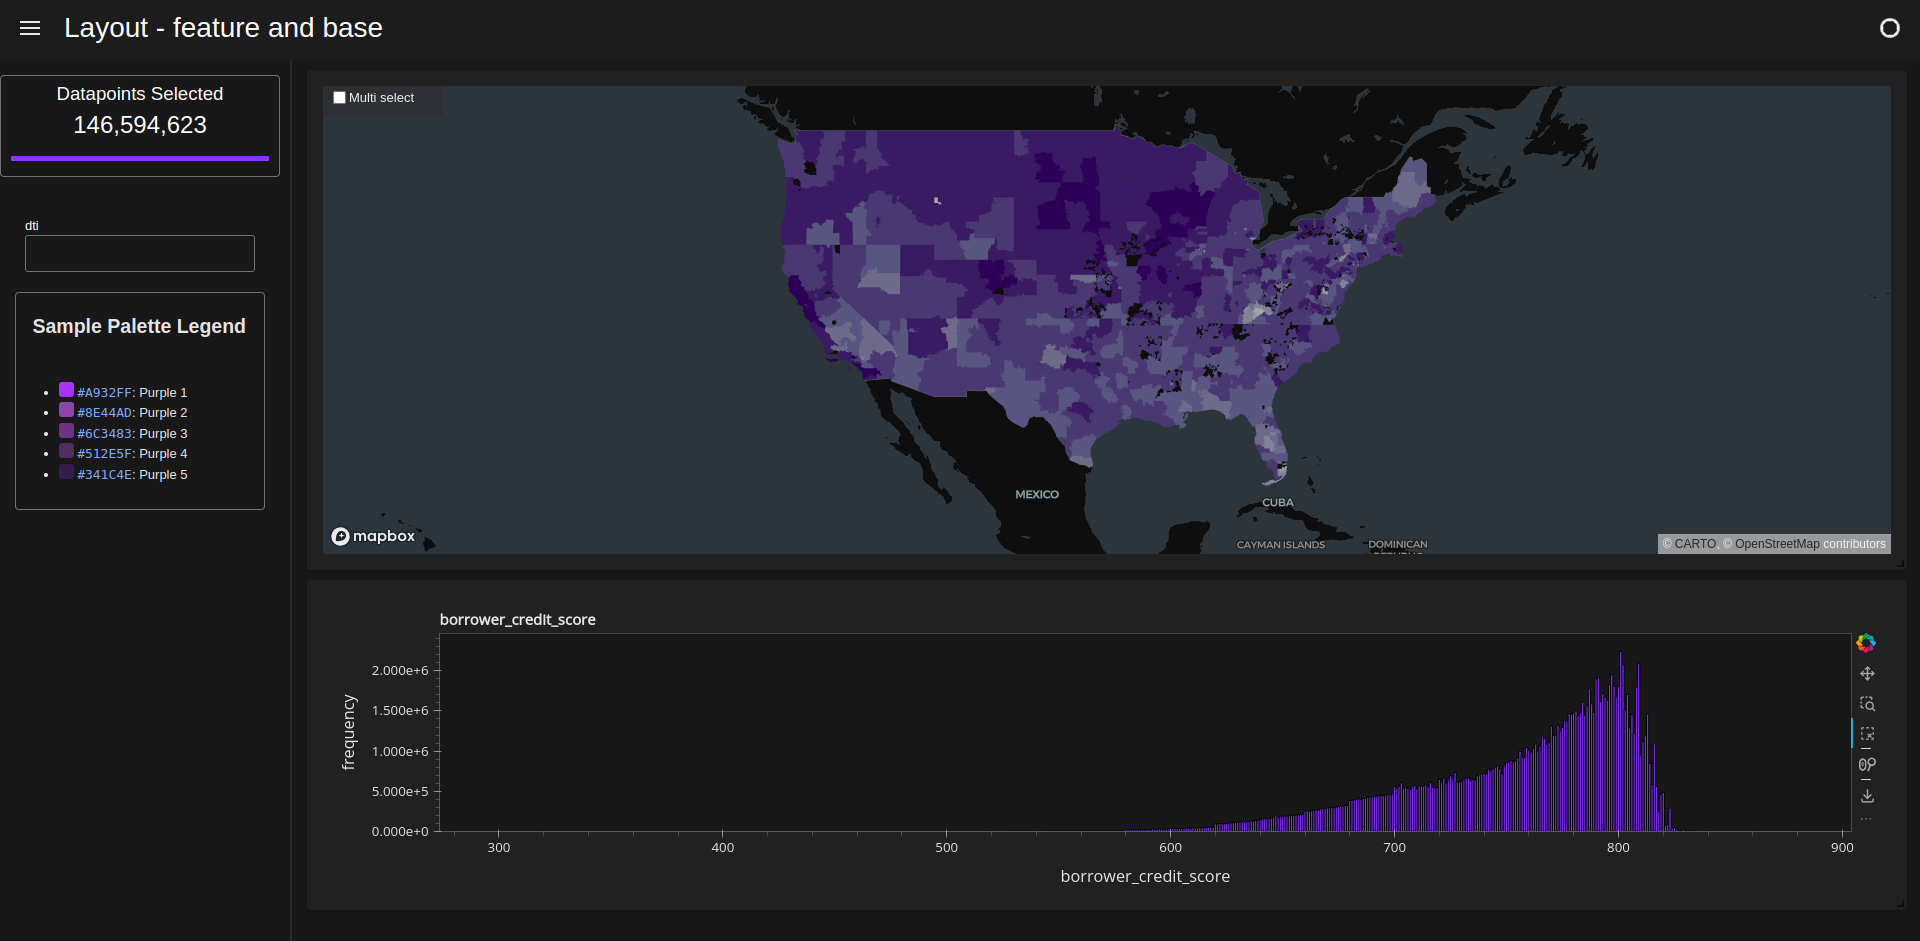
Feature and base#
[ ]:
d = cux_df.dashboard(
    charts_list,
    sidebar=widgets,
    layout=cuxfilter.layouts.feature_and_base,
    theme=cuxfilter.themes.rapids_dark,
    title="Layout - feature and base",
)
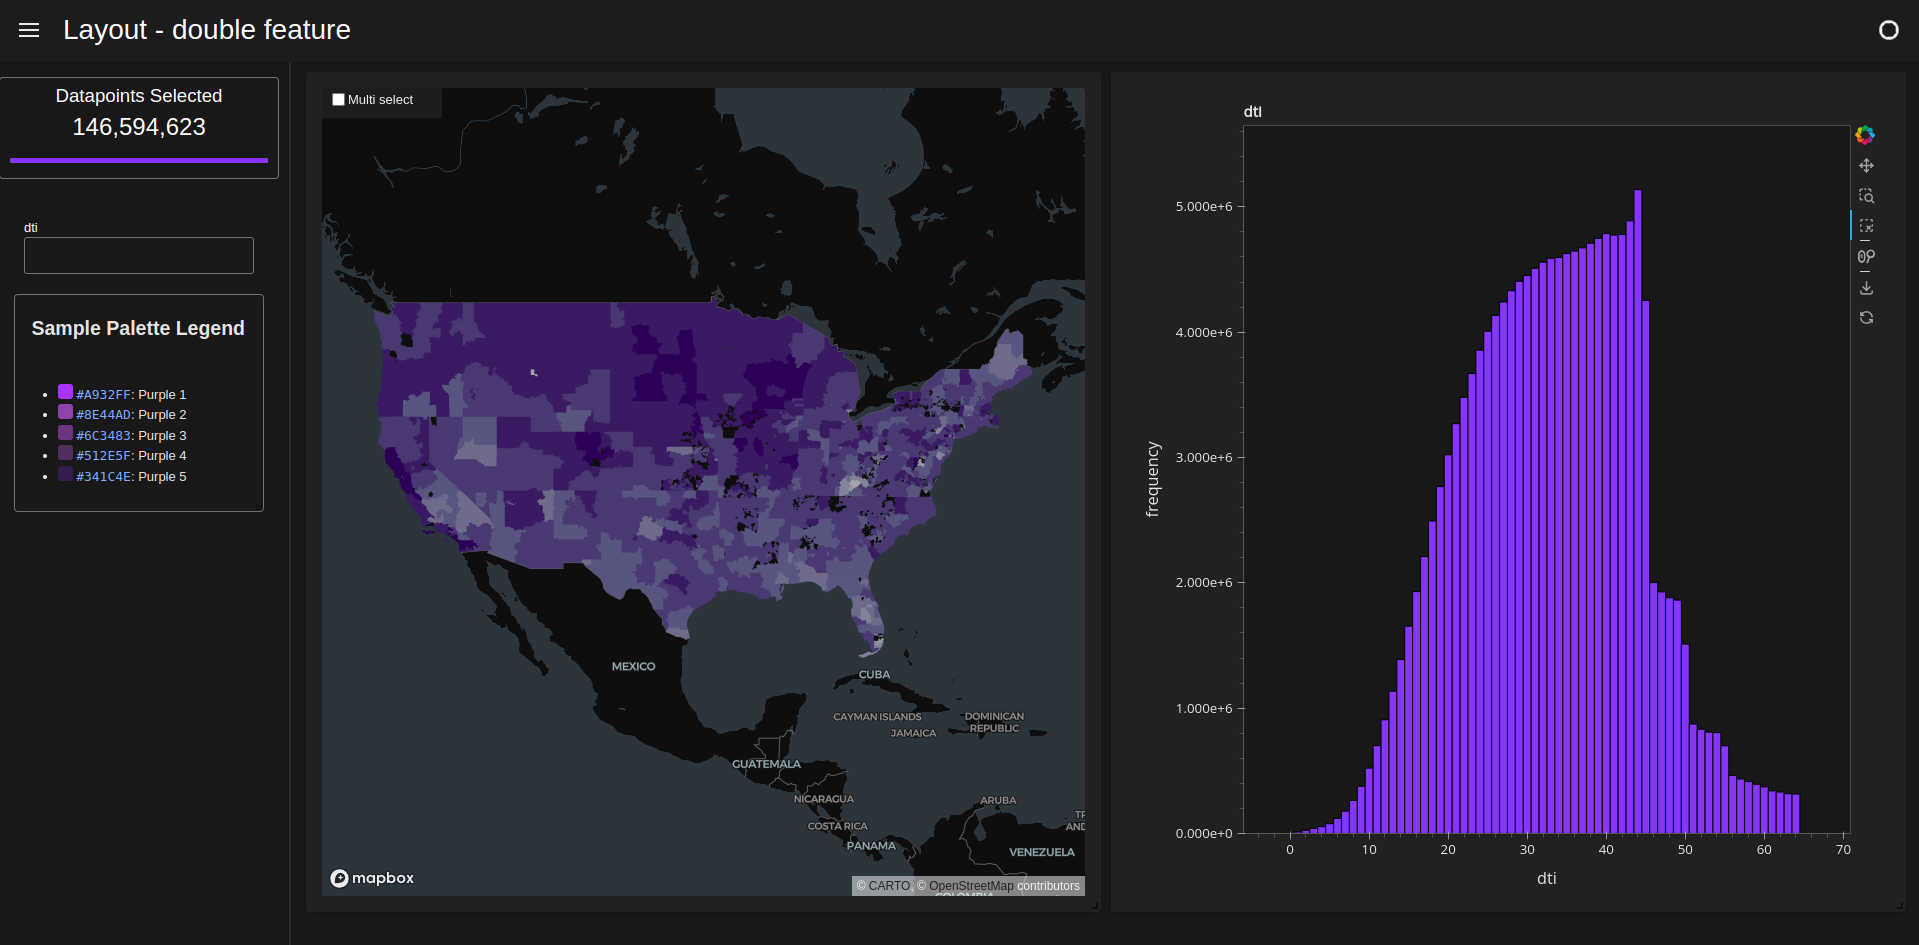
Double feature#
[ ]:
d = cux_df.dashboard(
    [chart0, chart1],
    sidebar=widgets,
    layout=cuxfilter.layouts.double_feature,
    theme=cuxfilter.themes.rapids_dark,
    title="Layout - double feature",
)
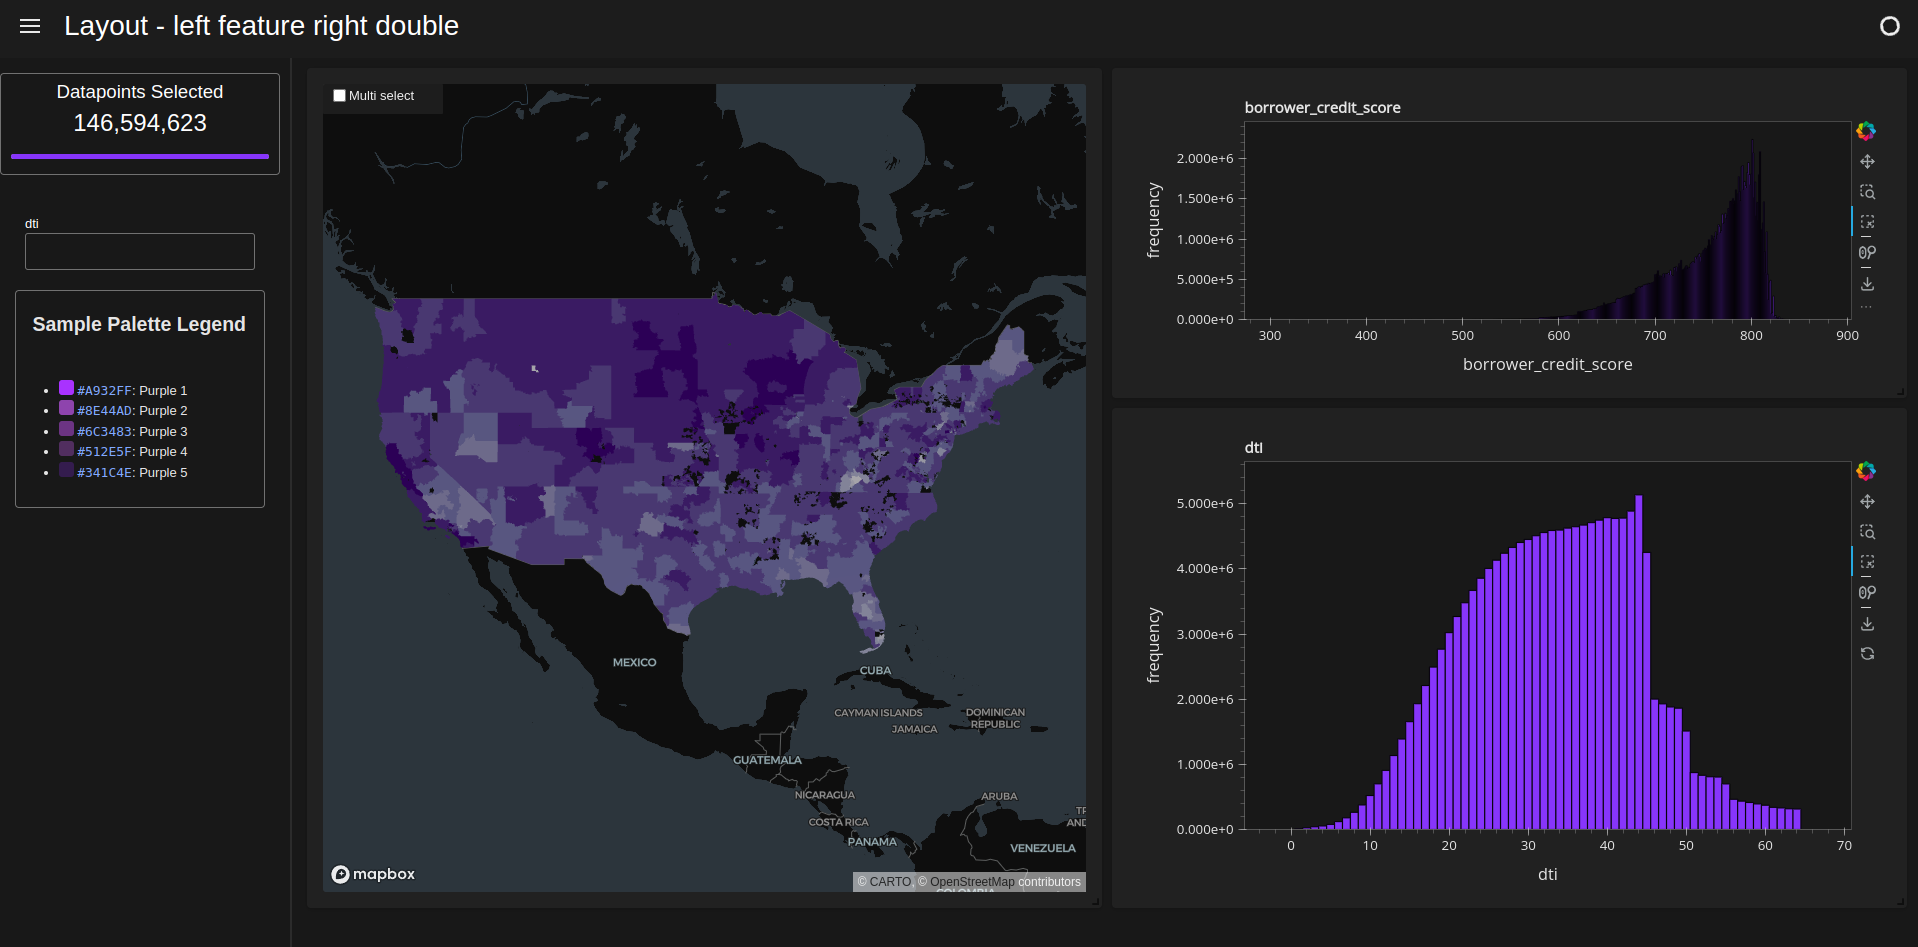
Left feature right double#
[ ]:
d = cux_df.dashboard(
    charts_list[:4],
    sidebar=widgets,
    layout=cuxfilter.layouts.left_feature_right_double,
    theme=cuxfilter.themes.rapids_dark,
    title="Layout - left feature right double",
)
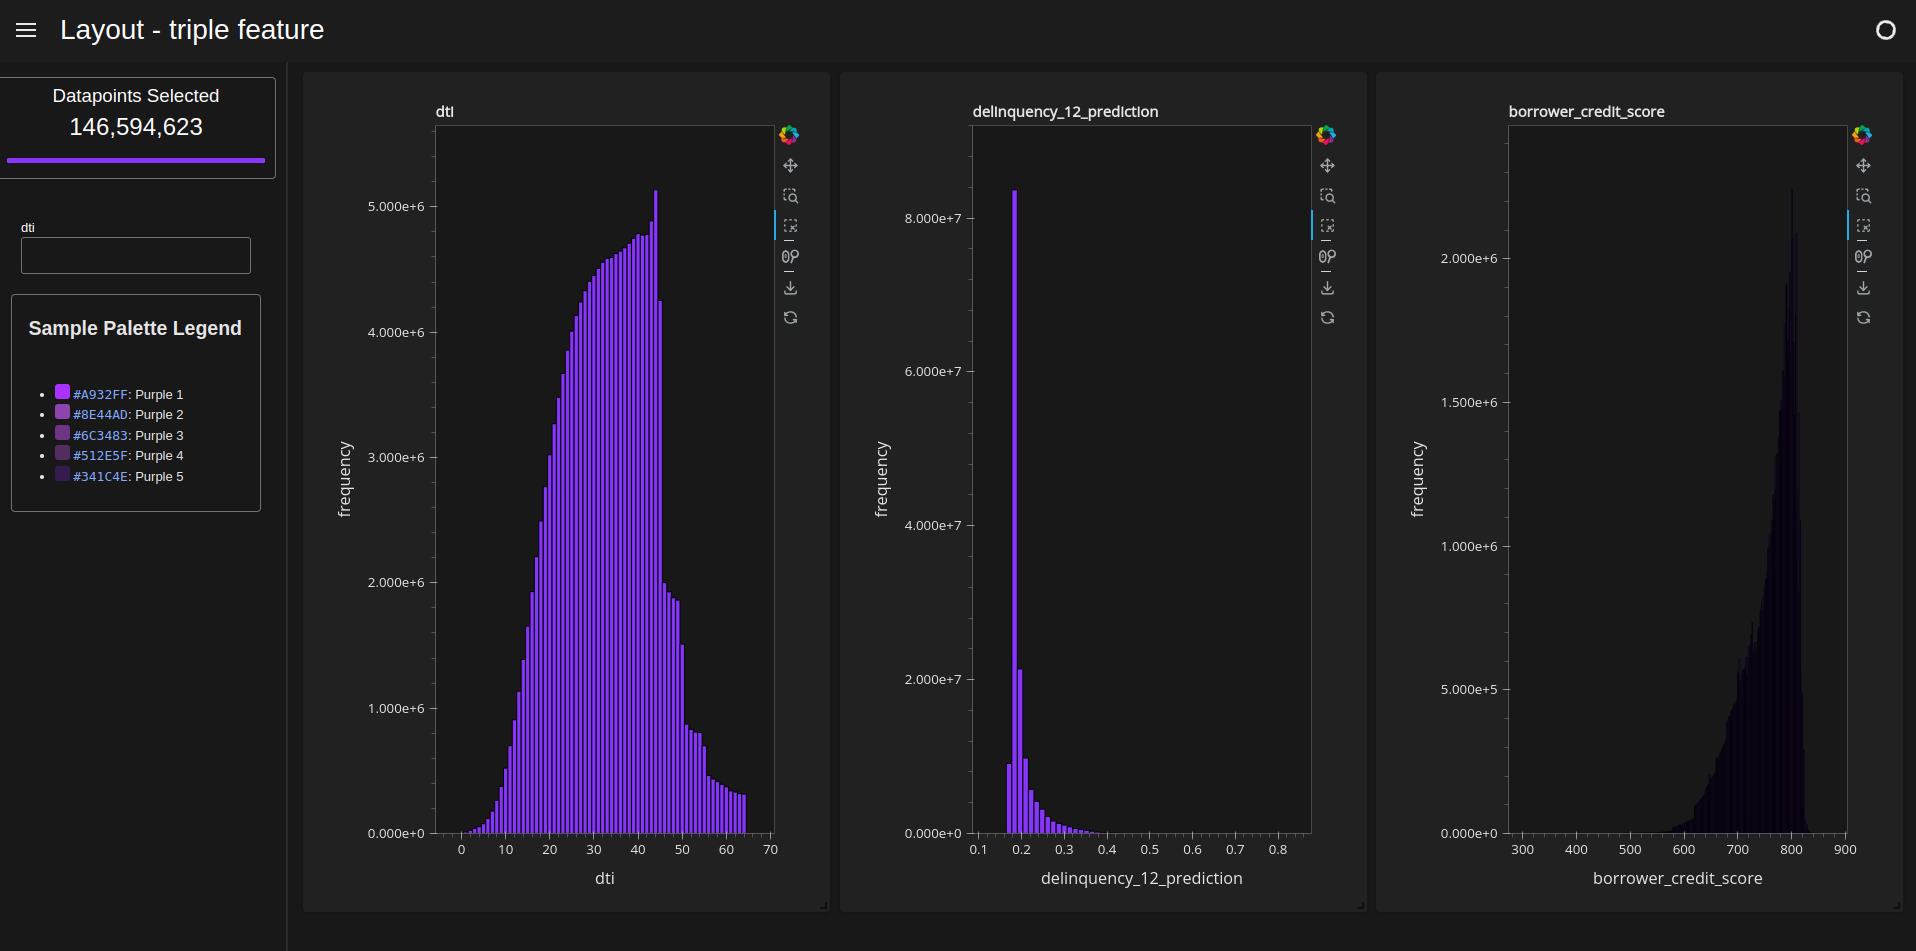
Triple feature#
[ ]:
d = cux_df.dashboard(
    [chart1, chart2, chart3],
    sidebar=widgets,
    layout=cuxfilter.layouts.triple_feature,
    theme=cuxfilter.themes.rapids_dark,
    title="Layout - triple feature",
)
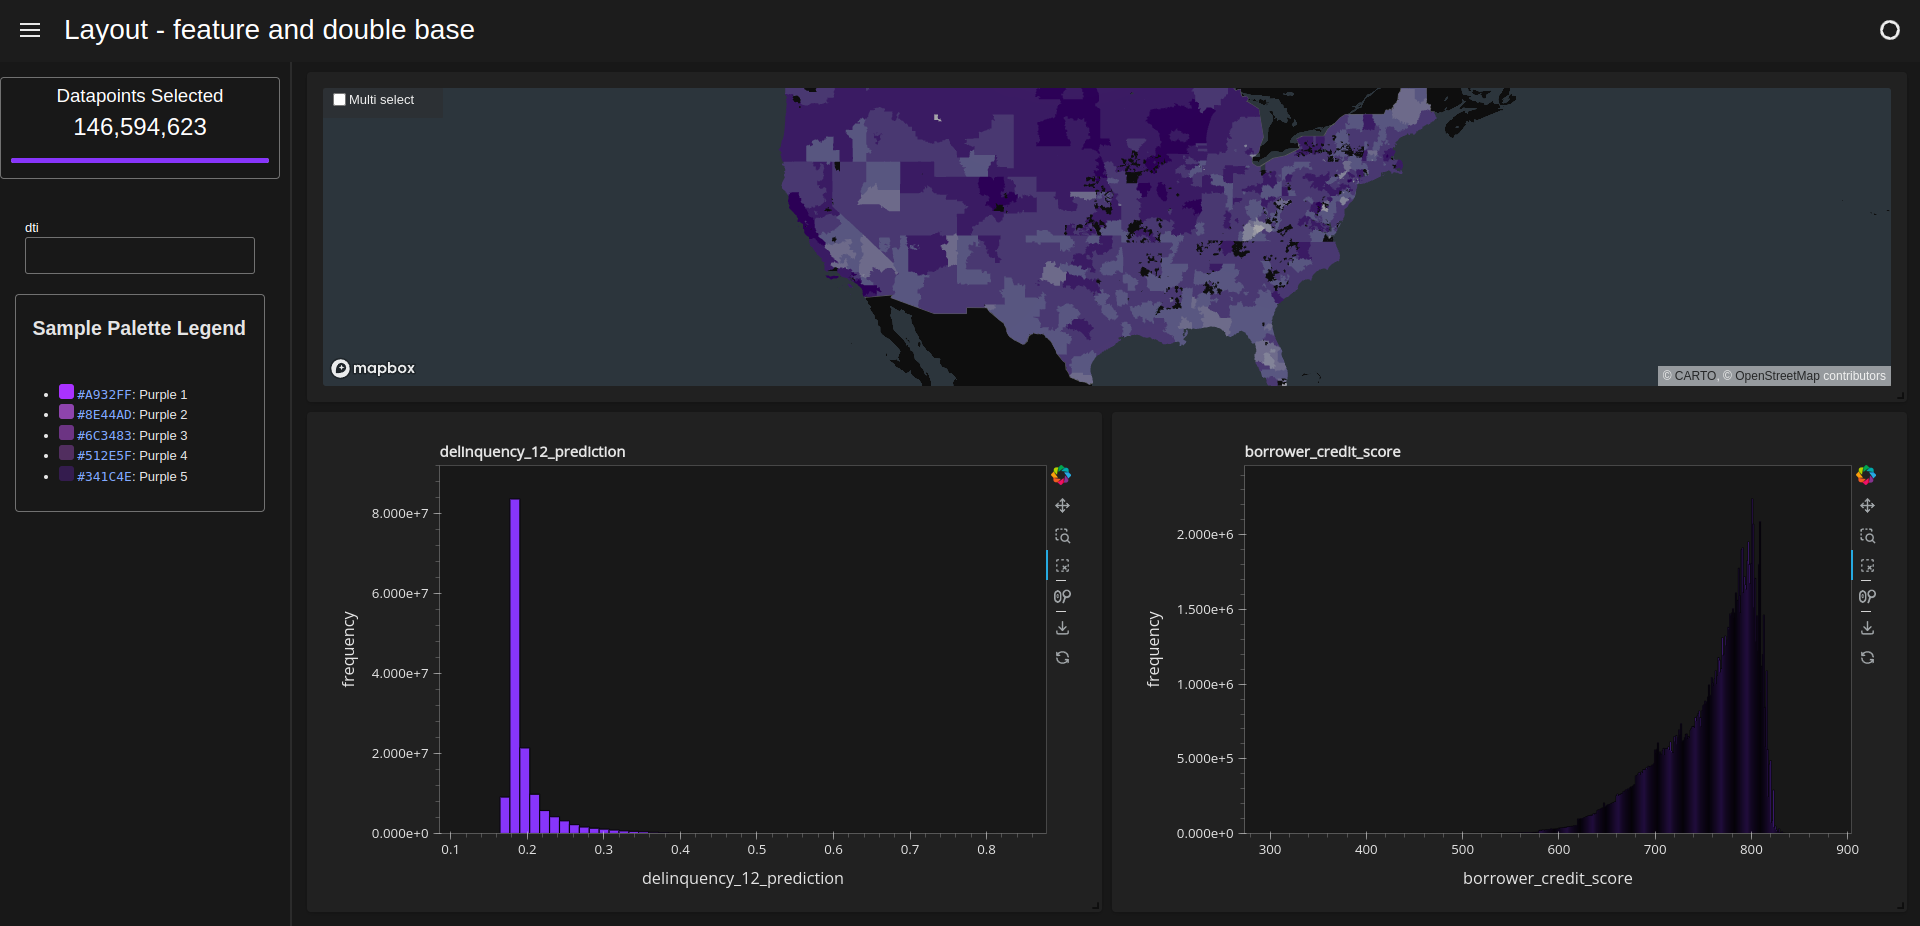
Feature and double base#
[ ]:
d = cux_df.dashboard(
    [chart0, chart2, chart3],
    sidebar=widgets,
    layout=cuxfilter.layouts.feature_and_double_base,
    theme=cuxfilter.themes.rapids_dark,
    title="Layout - feature and double base",
)
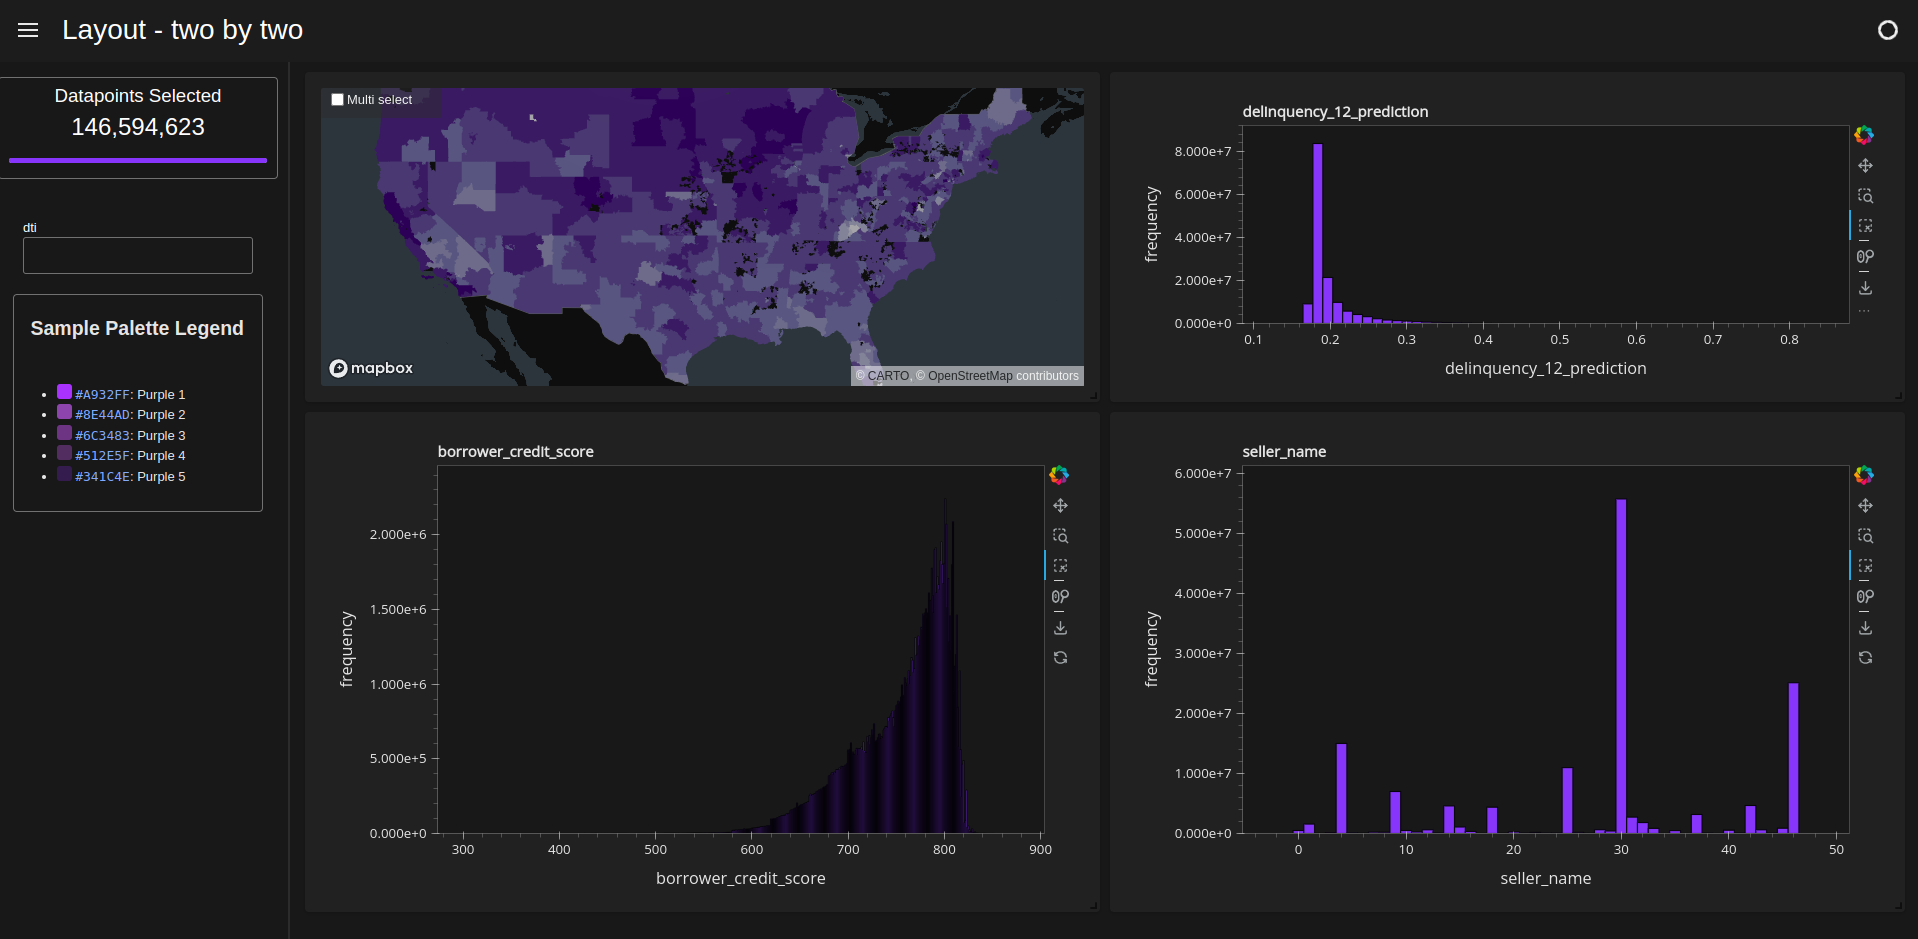
Two by two#
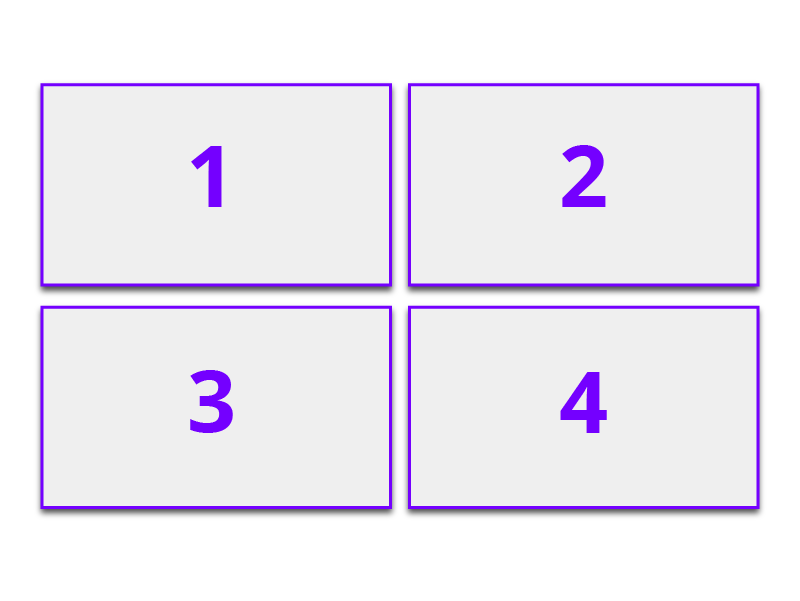
[ ]:
d = cux_df.dashboard(
    [chart0, chart2, chart3, chart4],
    sidebar=widgets,
    layout=cuxfilter.layouts.two_by_two,
    theme=cuxfilter.themes.rapids_dark,
    title="Layout - two by two",
)
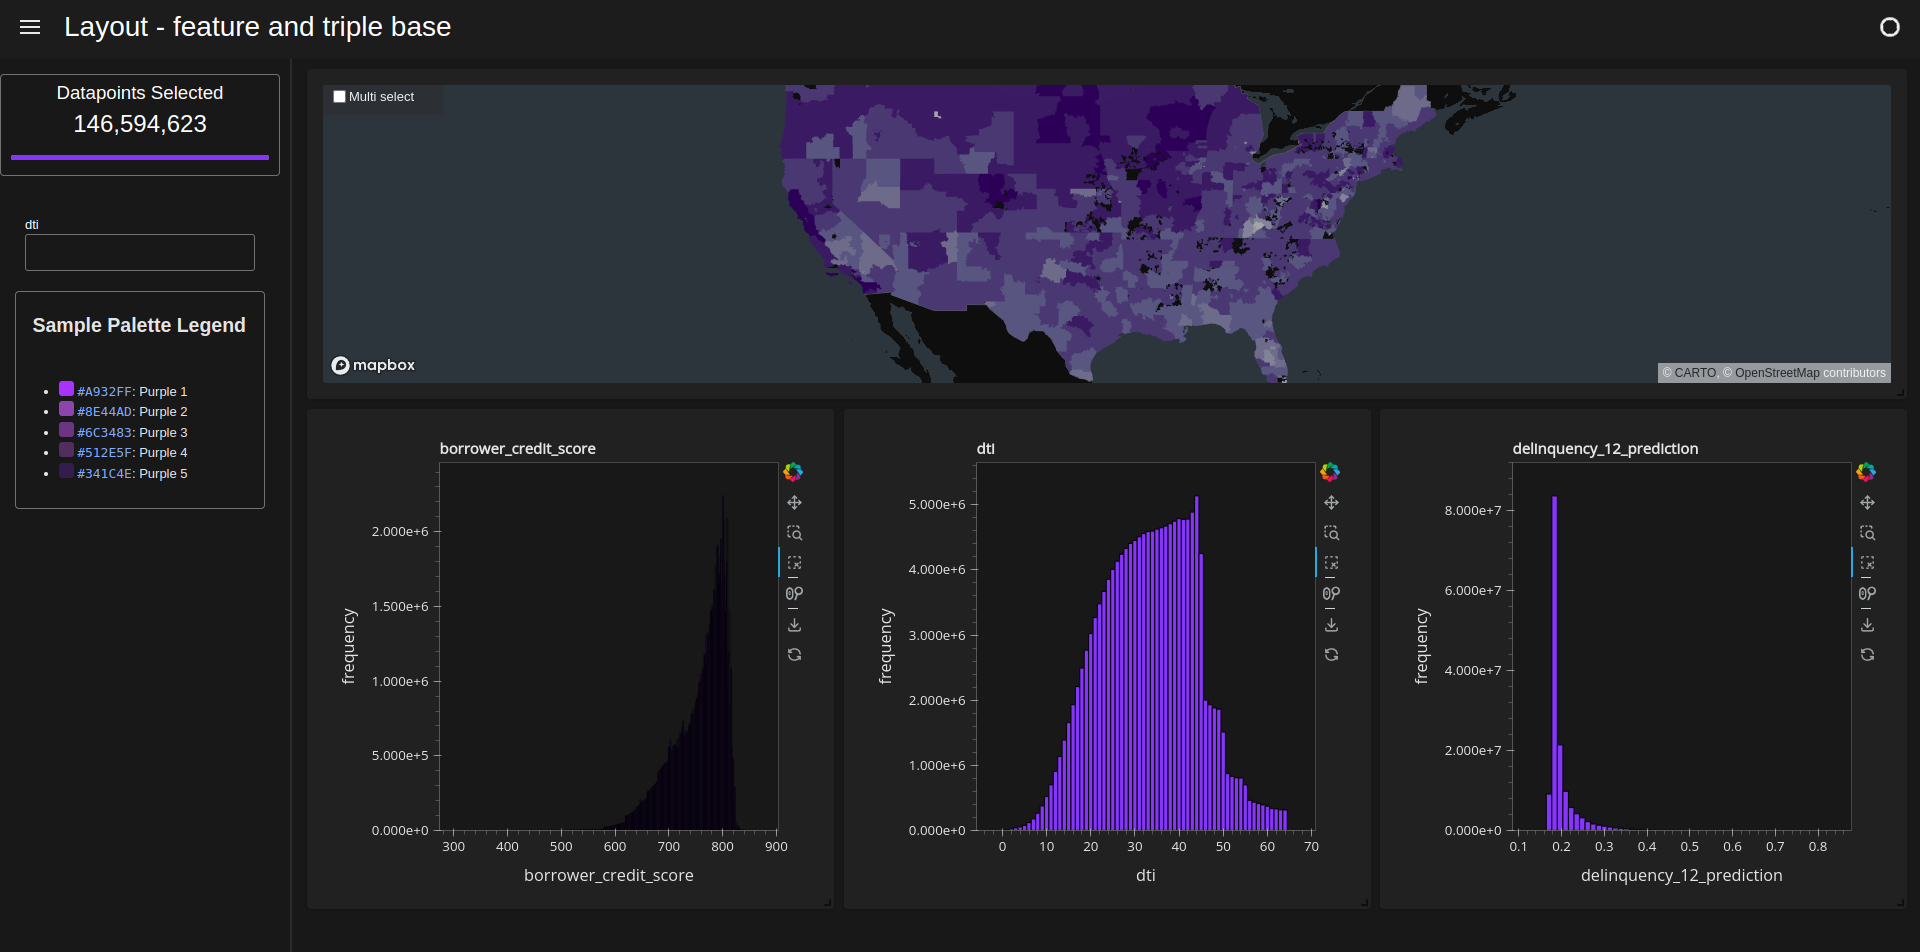
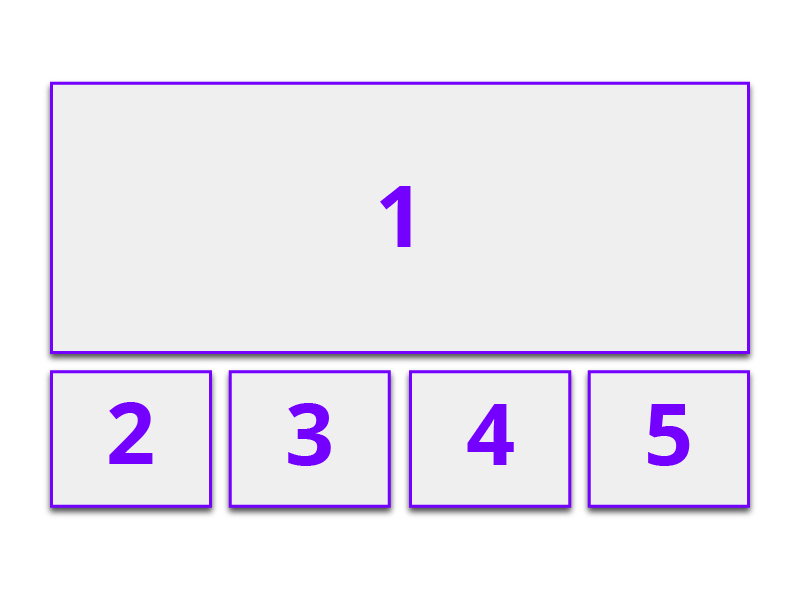
Feature and triple base#
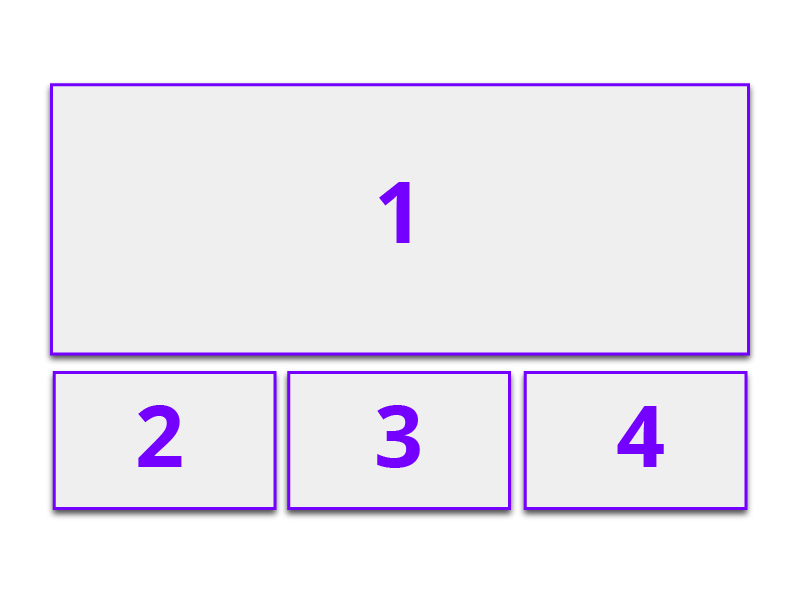
[ ]:
d = cux_df.dashboard(
    charts_list,
    sidebar=widgets,
    layout=cuxfilter.layouts.feature_and_triple_base,
    theme=cuxfilter.themes.rapids_dark,
    title="Layout - feature and triple base",
)
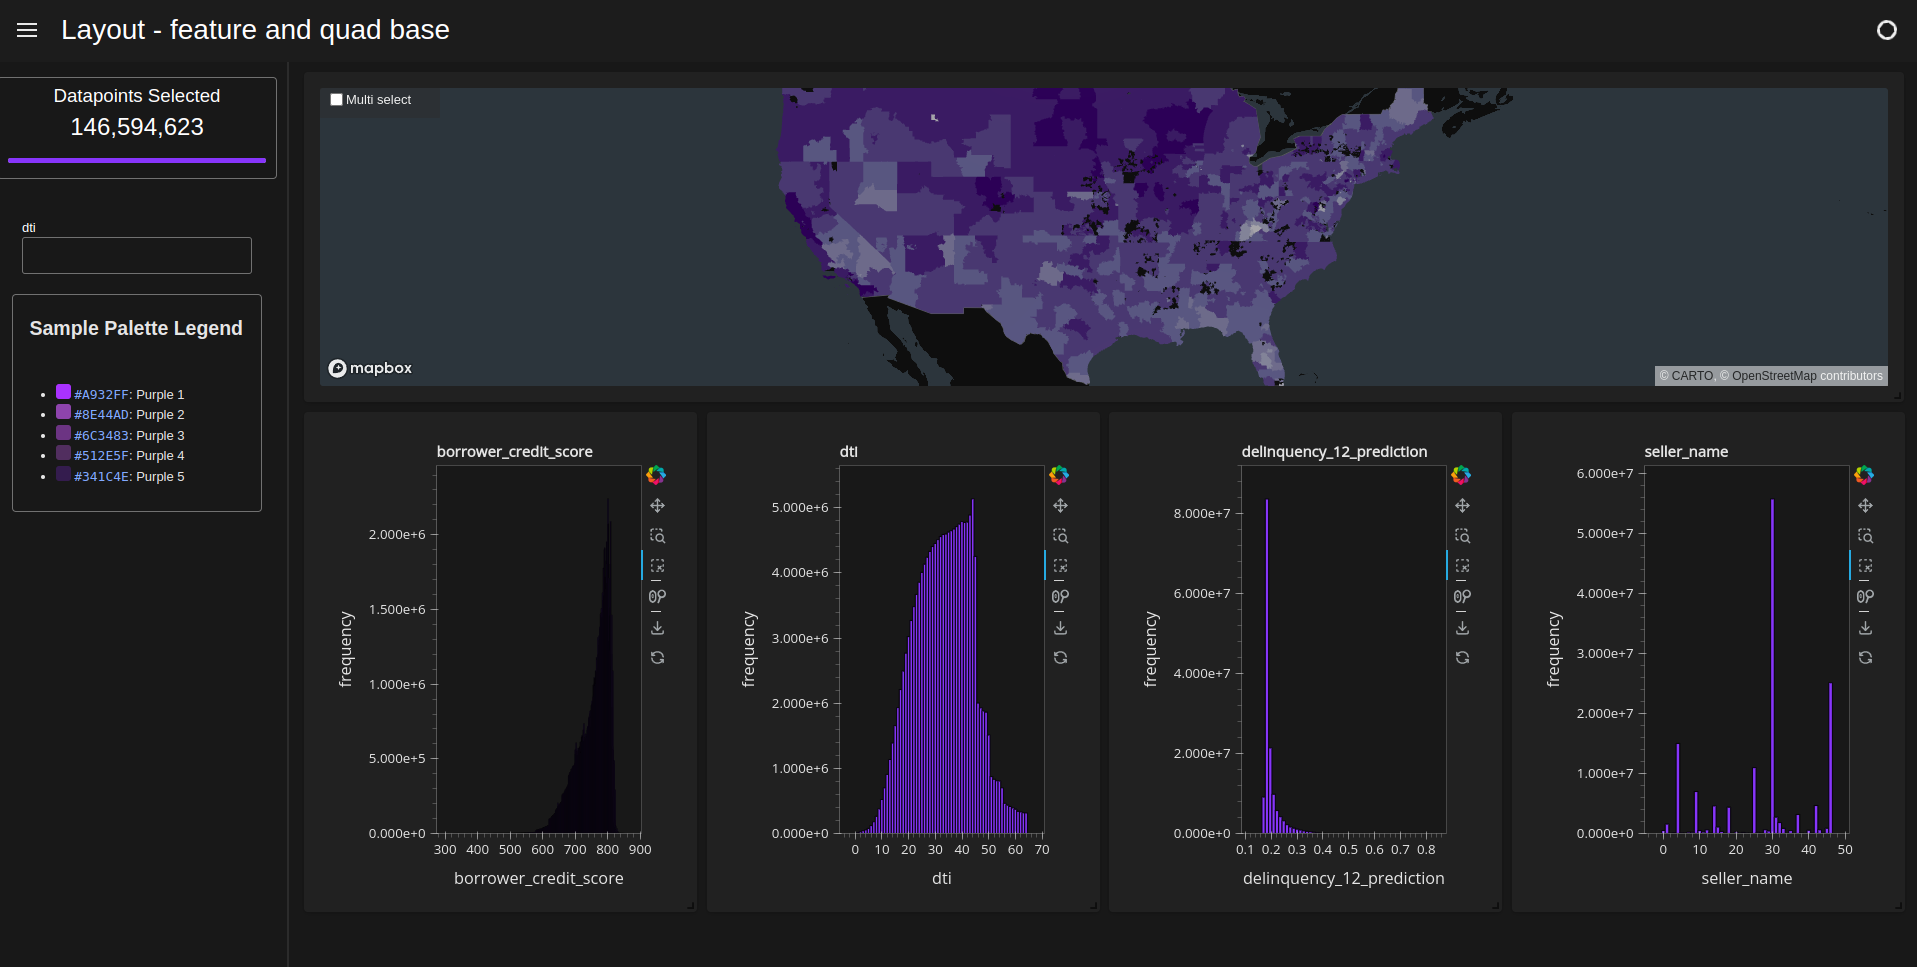
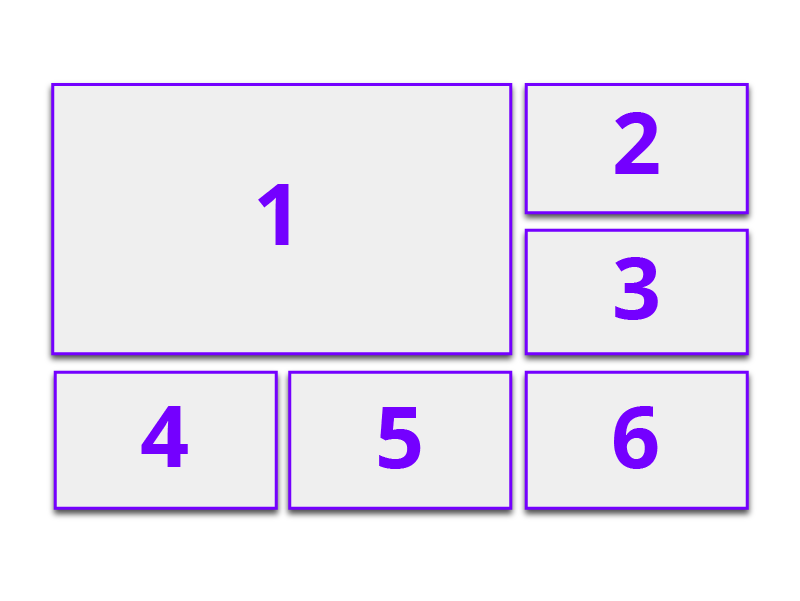
Feature and quad base#
[ ]:
d = cux_df.dashboard(
    charts_list,
    sidebar=widgets,
    layout=cuxfilter.layouts.feature_and_quad_base,
    theme=cuxfilter.themes.rapids_dark,
    title="Layout - feature and quad base",
)
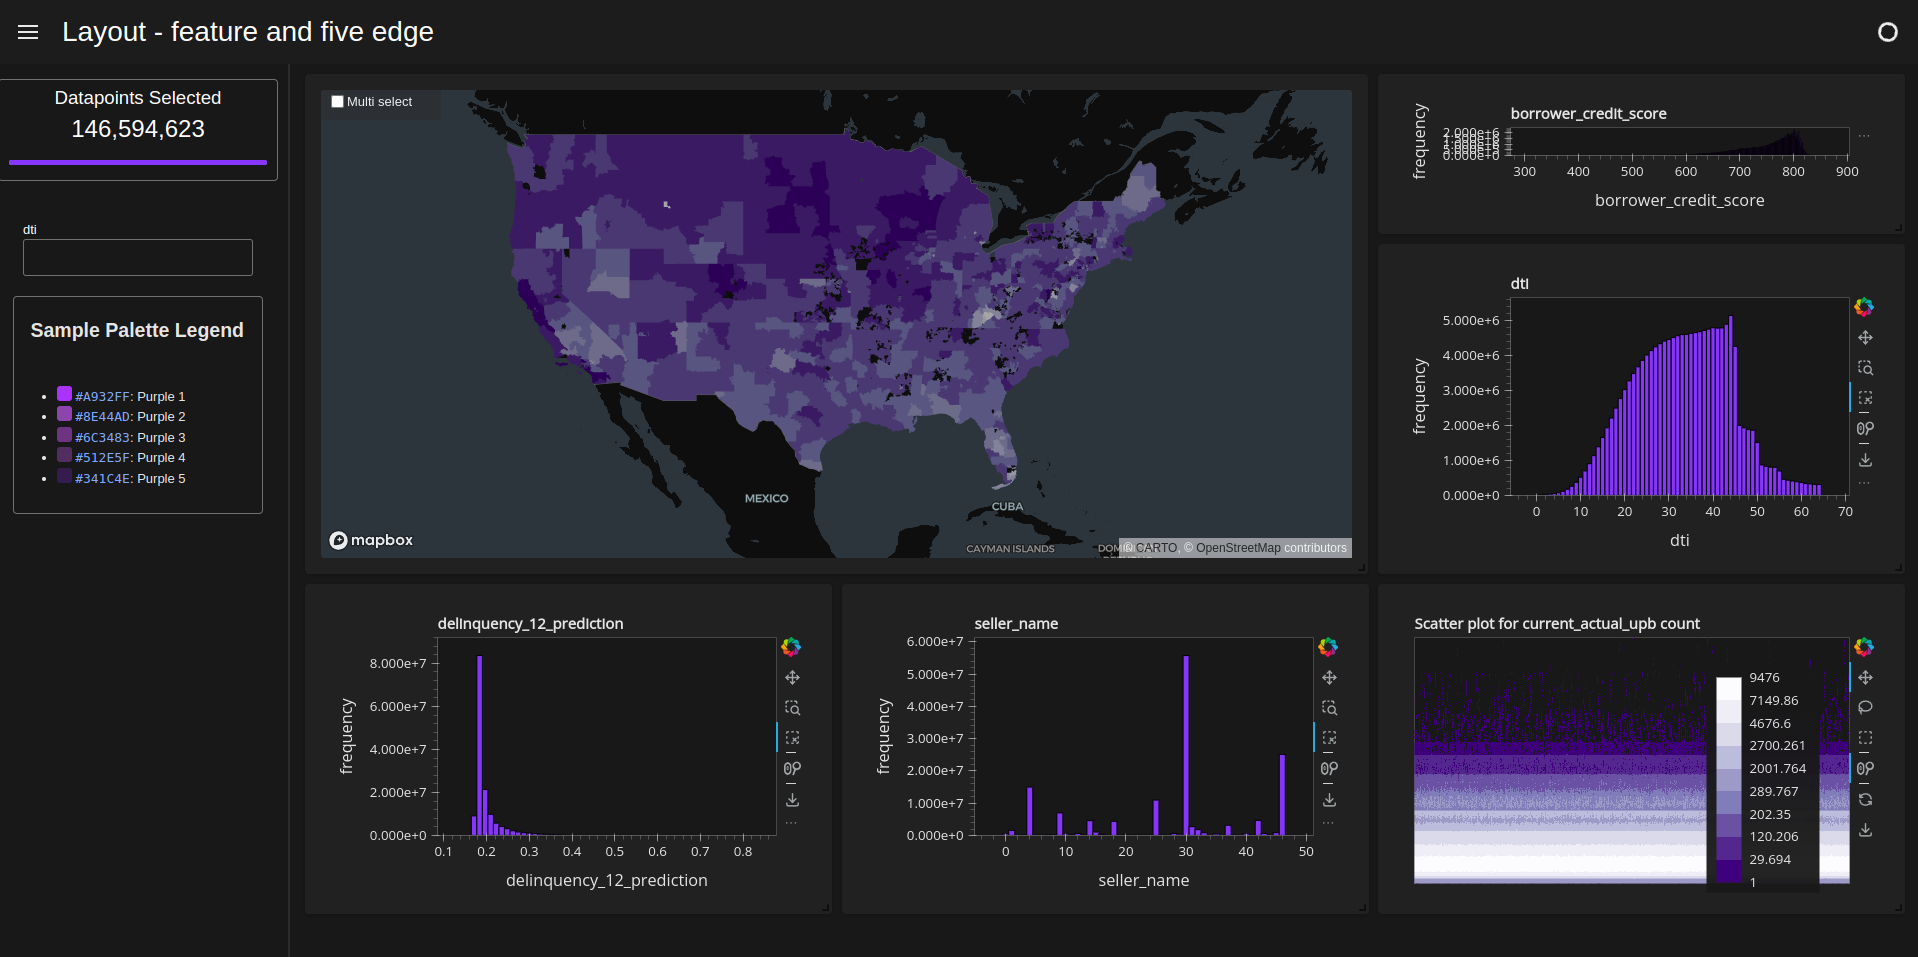
Feature and five edge#
[ ]:
d = cux_df.dashboard(
    charts_list,
    sidebar=widgets,
    layout=cuxfilter.layouts.feature_and_five_edge,
    theme=cuxfilter.themes.rapids_dark,
    title="Layout - feature and five edge",
)
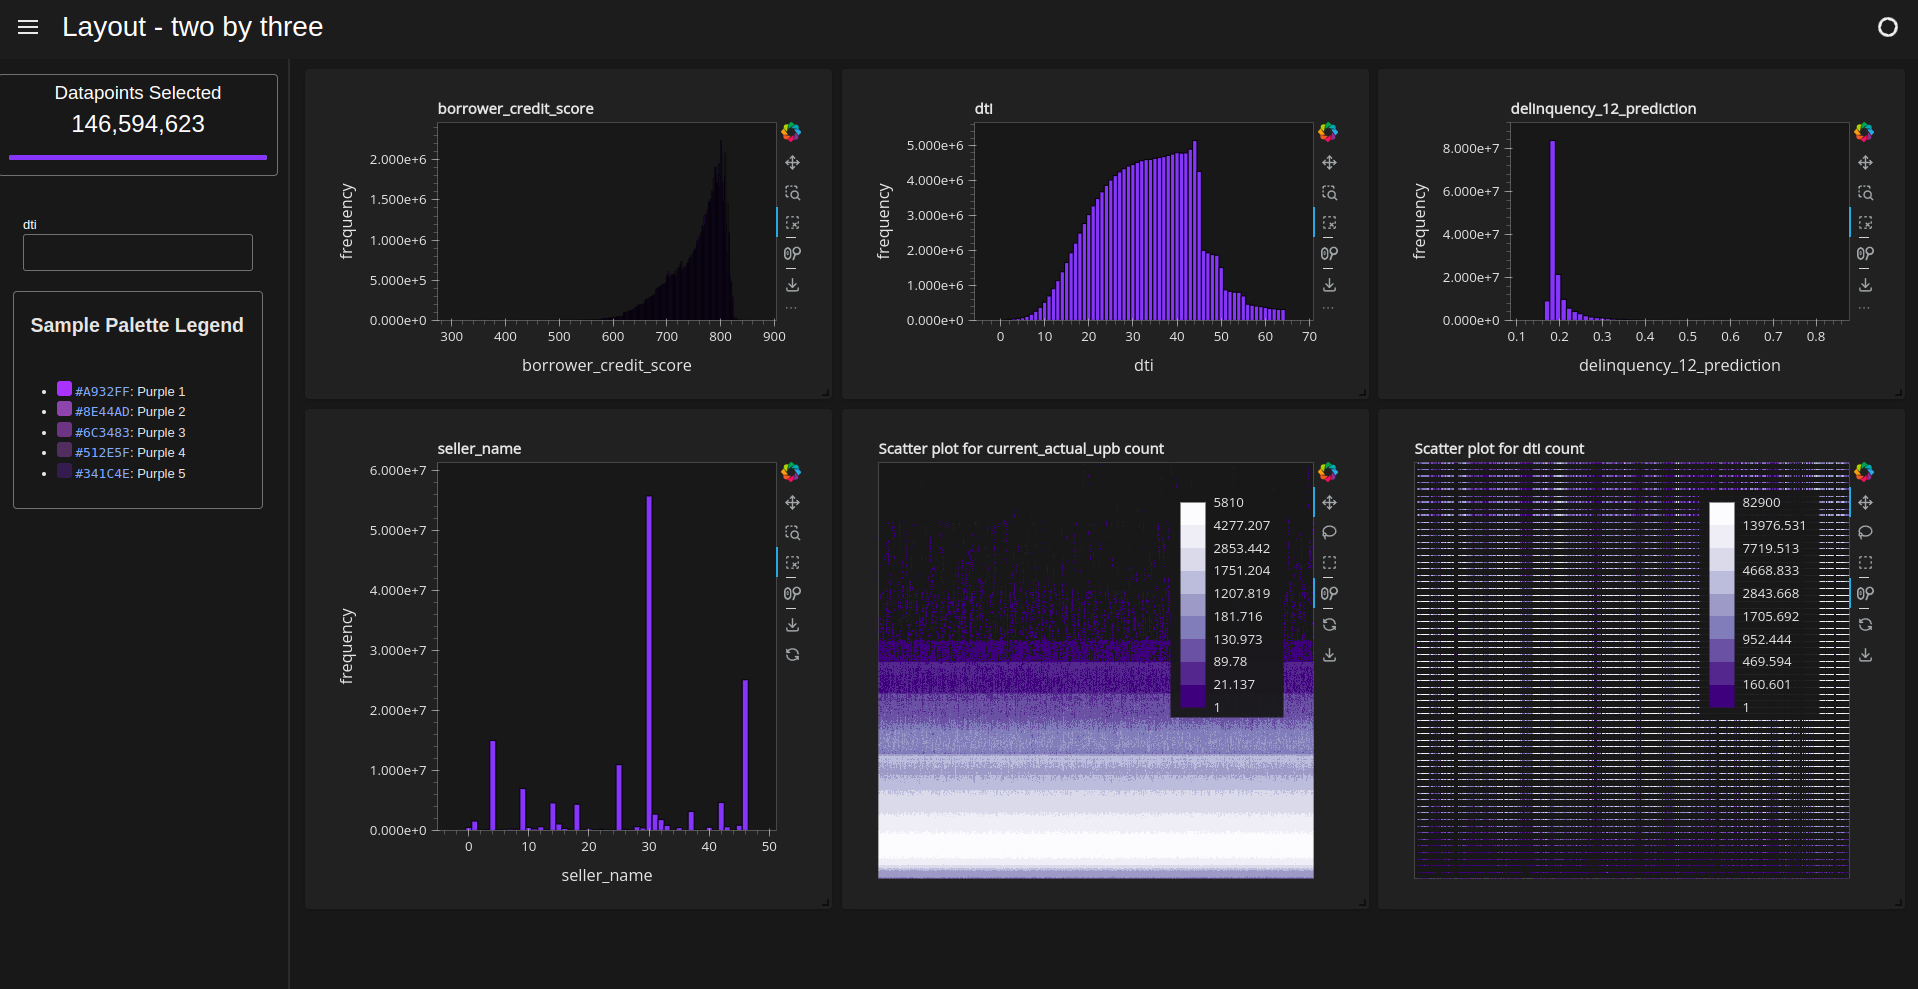
Two by three#
[ ]:
d = cux_df.dashboard(
    [chart3, chart1, chart2, chart4, chart5, chart6],
    sidebar=widgets,
    layout=cuxfilter.layouts.two_by_three,
    theme=cuxfilter.themes.rapids_dark,
    title="Layout - two by three",
)
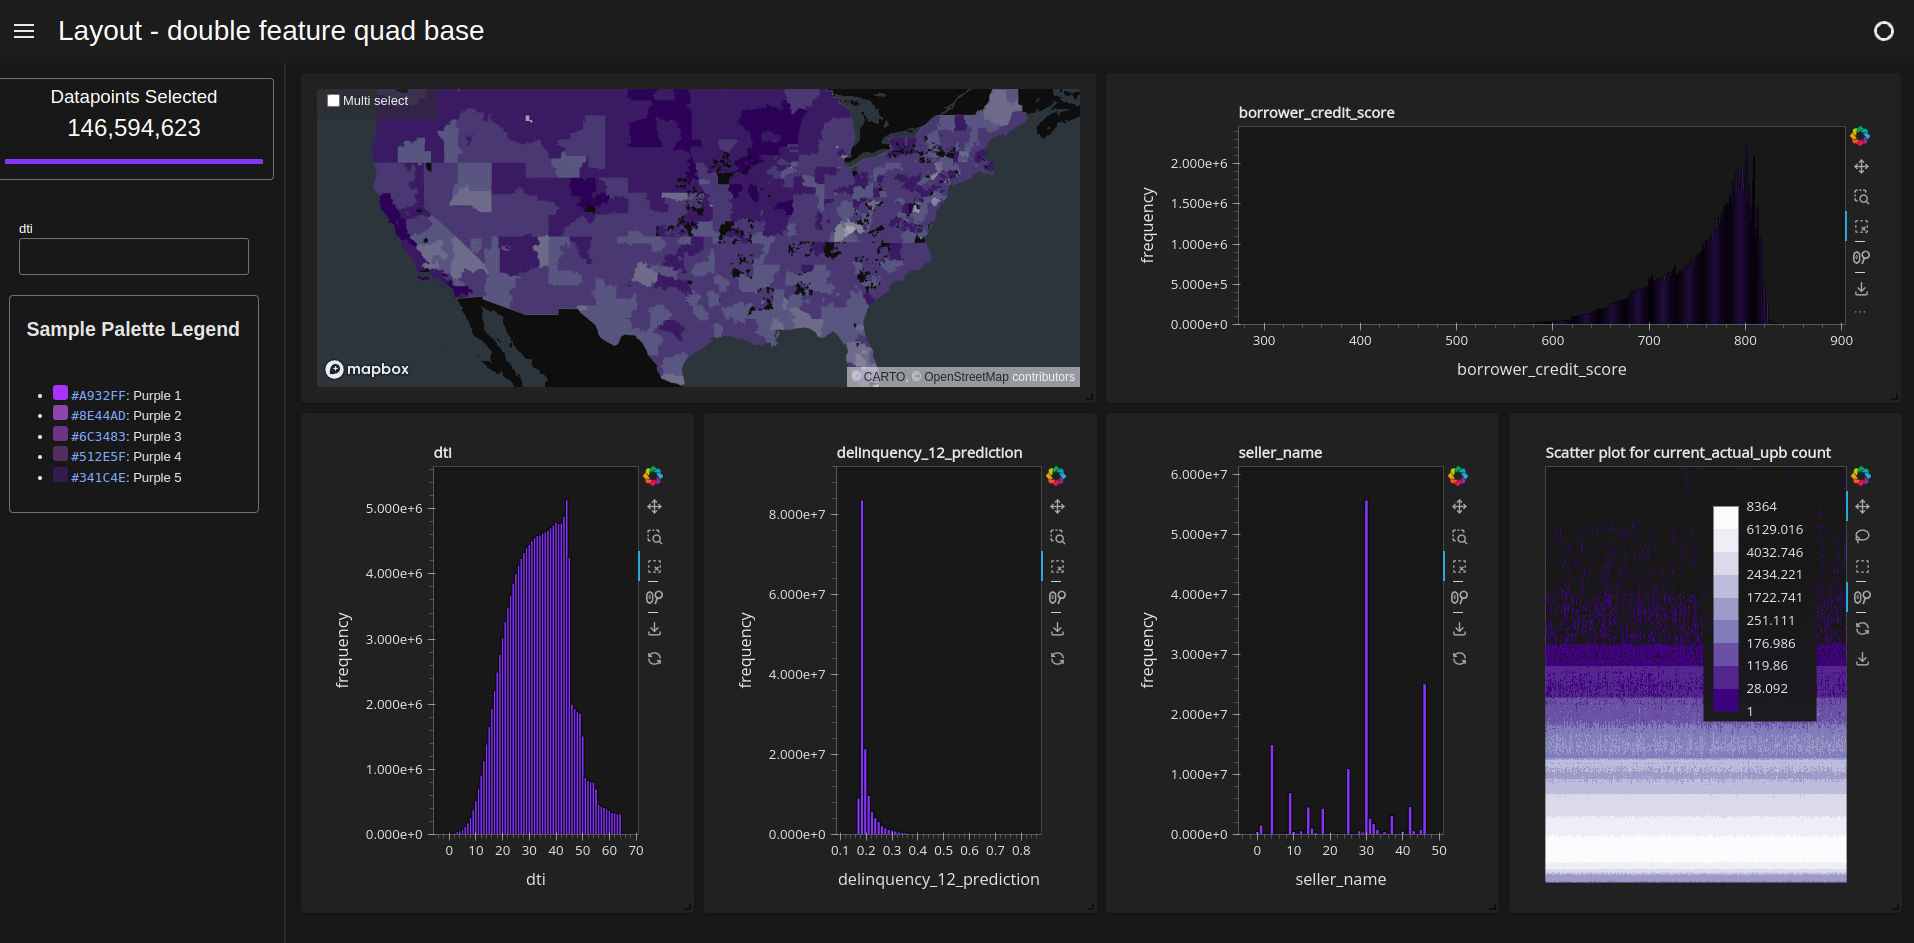
Double feature quad base#
[ ]:
d = cux_df.dashboard(
    charts_list,
    sidebar=widgets,
    layout=cuxfilter.layouts.double_feature_quad_base,
    theme=cuxfilter.themes.rapids_dark,
    title="Layout - double feature quad base",
)
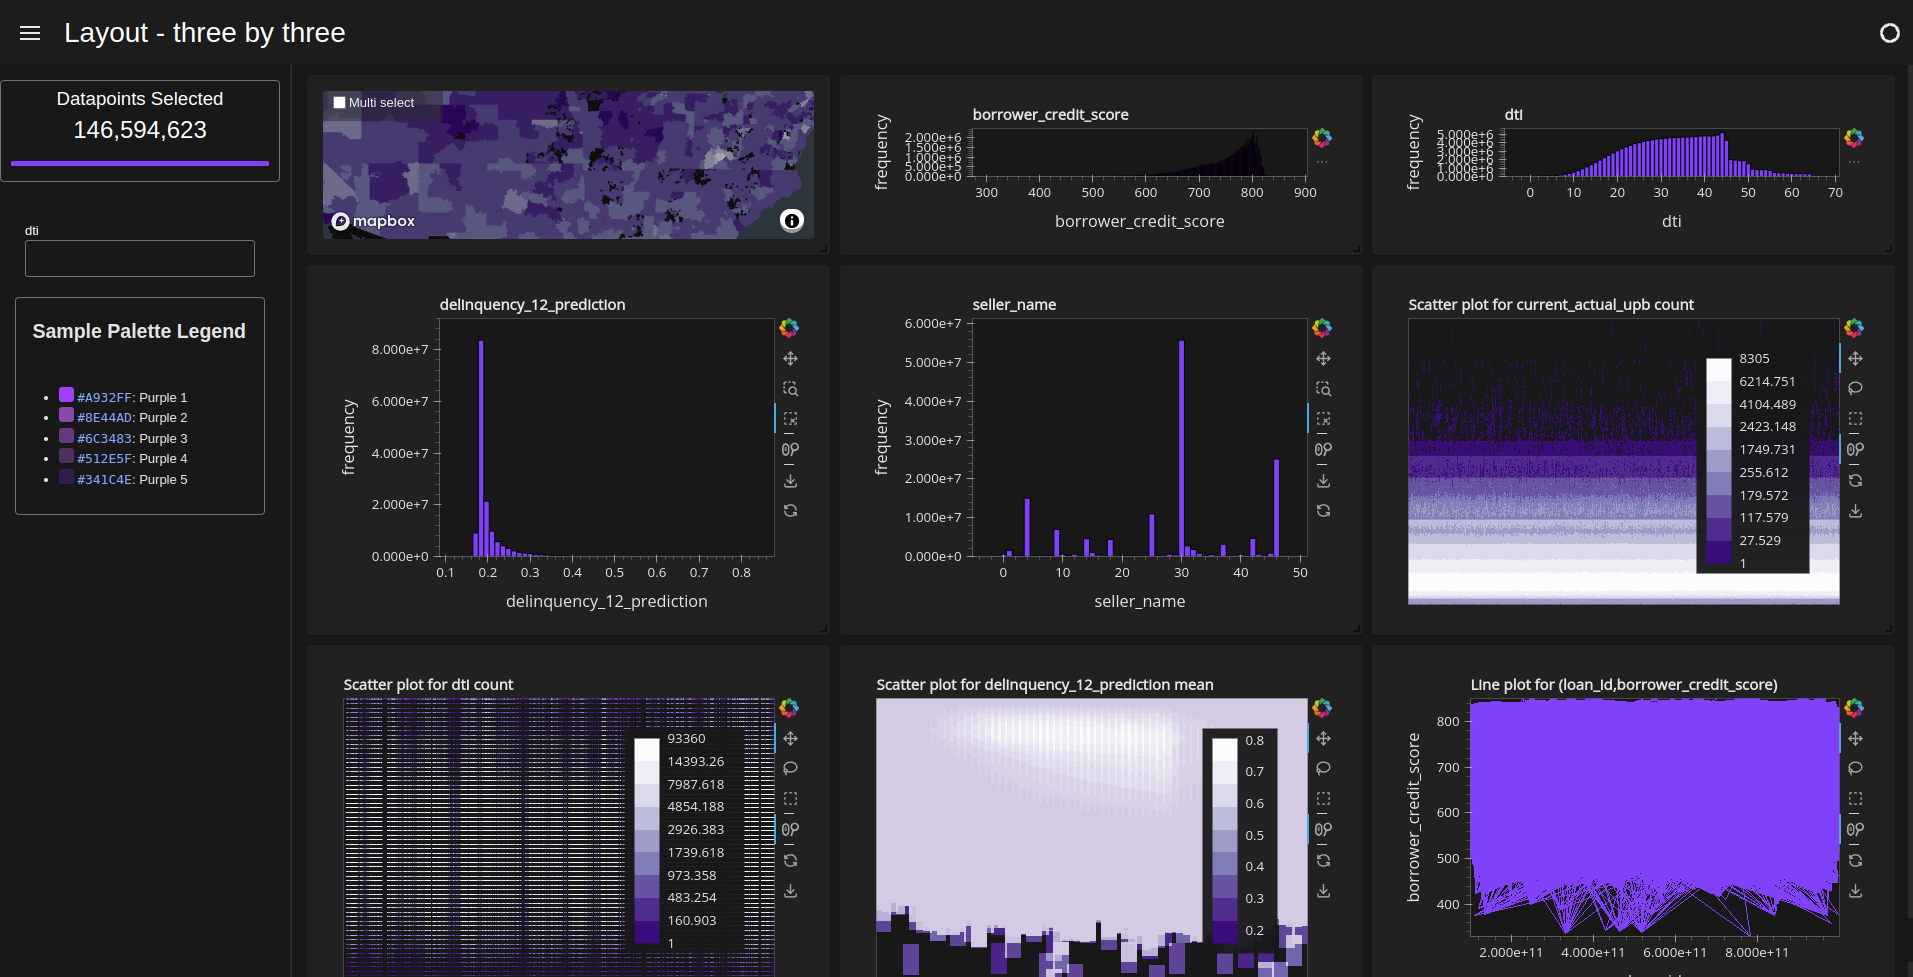
Three by three#
[ ]:
d = cux_df.dashboard(
    charts_list,
    sidebar=widgets,
    layout=cuxfilter.layouts.three_by_three,
    theme=cuxfilter.themes.rapids_dark,
    title="Layout - three by three",
)
[ ]: